• Sign up for the Daily Digest Email!
  • Twitter
  • Facebook
  • Google Plus One
  • RSS

REIT REPORT

REIT news, Real Estate Investment Trusts, Canadian REIT News, REIT Stocks Canada

  • Home
  • Headlines
  • Daily Digest Email
  • Canadian REITs

Real Matters Announces Amendment to Normal Course Issuer Bid

May 9, 2022 By Business Wire

TORONTO–(BUSINESS WIRE)–Real Matters Inc. (“Real Matters” or the “Company”) (TSX: REAL) today announced that the Toronto Stock Exchange (“TSX”) has approved an amendment to the Company’s current Normal Course Issuer Bid (“NCIB”) to increase the number of common shares that the Company may purchase for cancellation from 6,000,000 common shares (approximately 7.8% of the 76,489,997 common shares in the public float as at May 31, 2021) to 7,648,999 common shares (representing 10.0% of the 76,489,997 common shares in the public float as at May 31, 2021). No other terms of the NCIB have changed.

The Company believes that the prevailing share price for its common shares does not currently reflect its underlying value such that the purchase of common shares for cancellation represents an attractive opportunity to return value to the Company’s common shareholders.

Since commencement of the NCIB, Real Matters has purchased for cancellation 4,147,256 common shares at a weighted average price of $11.78. The Company’s previously approved NCIB commenced on June 11, 2021 and was amended on November 24, 2021. The further amended NCIB will commence on May 10, 2022 and will continue until June 10, 2022, or such earlier date as the Company has acquired the maximum number of common shares permitted under the NCIB or spent C$70 million. The Company has allocated up to C$70 million towards the purchase of common shares under the NCIB, of which C$48,860,512 has been spent to date, leaving C$21,139,488 available for purchases. The actual number of common shares purchased by the Company under the NCIB and the timing of such purchases will be determined by the Company. Subject to certain prescribed exceptions, daily purchases under the further amended NCIB will continue to be limited to a maximum of 153,956 common shares, which is 25% of the average daily trading volume of the Company’s common shares for the six months ended May 31, 2021 (being 615,827 common shares).

Purchases under the NCIB will continue to be made through the facilities of the TSX and alternative Canadian trading systems at the prevailing market price at the time of acquisition. All common shares purchased will be cancelled.

Real Matters previously entered into an automatic share purchase plan (the “Plan”) with National Bank Financial Inc. to allow for the purchase of common shares under the NCIB at times when the Company would not ordinarily be active in the market due to its own internal trading blackout periods, insider trading rules or otherwise. The Plan will continue to apply to the further amended NCIB.

FORWARD-LOOKING INFORMATION

This Press Release contains “forward-looking information” within the meaning of applicable Canadian securities laws, including statements relating to the Company’s belief regarding the intrinsic value of its common shares. Words such as “could”, “forecast”, “target”, “may”, “will”, “would”, “expect”, “anticipate”, “estimate”, “intend”, “plan”, “seek”, “believe”, “likely” and “predict” and variations of such words and similar expressions are intended to identify such forward-looking information, although not all forward-looking information contains these identifying words.

The forward-looking information in this press release includes statements which reflect the current expectations of management based on information currently available to management. Although the Company believes that these expectations are reasonable, these statements by their nature involve risks and uncertainties and should not be read as a guarantee of the occurrence or timing of any future events, performance or results. A comprehensive discussion of the factors which could cause results or events to differ from current expectations can be found in the “Risk Factors” section of our Annual Information Form for the year ended September 30, 2021, which is available on SEDAR at www.sedar.com.

Readers are cautioned not to place undue reliance on the forward-looking information, which reflect our expectations only as of the date of this Press Release. Except as required by law, we do not undertake to update or revise any forward-looking information, whether as a result of new information, future events or otherwise.

About Real Matters

Real Matters is a leading network management services provider for the mortgage lending and insurance industries. Real Matters’ platform combines its proprietary technology and network management capabilities with tens of thousands of independent qualified field professionals to create an efficient marketplace for the provision of mortgage lending and insurance industry services. Our clients include top 100 mortgage lenders in the U.S. and some of the largest insurance companies in North America. We are a leading independent provider of residential real estate appraisals to the mortgage market and a leading independent provider of title and mortgage closing services in the U.S. Headquartered in Markham (ON), Real Matters has principal offices in Buffalo (NY), Middletown (RI) and Scottsdale (AZ). Real Matters is listed on the Toronto Stock Exchange under the symbol REAL. For more information, visit www.realmatters.com.

Contacts

For more information:
Lyne Beauregard

Vice President, Investor Relations and Corporate Communications

Real Matters

lbeauregard@realmatters.com
416.994.5930

Dream Office REIT Reports Q1 2022 Results

May 6, 2022 By Business Wire

This press release contains forward-looking information that is based upon assumptions and is subject to risks and uncertainties as indicated in the cautionary note contained within this press release.

TORONTO–(BUSINESS WIRE)–DREAM OFFICE REAL ESTATE INVESTMENT TRUST (D.UN-TSX) or (“Dream Office REIT”, the “Trust” or “we”) today announced its financial results for the three months ended March 31, 2022 and provided a business update related to the COVID-19 pandemic.


OPERATIONAL HIGHLIGHTS

(unaudited)

As at


March 31,


December 31,


March 31,


2022


2021


2021

Total properties(1)


Number of active properties


29


29


28

Number of properties under development


1


1


2

Gross leaseable area (“GLA”) (in millions of sq. ft.)


5.5


5.5


5.5

Investment properties value

$

2,596,240


$

2,569,002


$

2,473,123

Total portfolio(2)


Occupancy rate – including committed (period-end)


85.0%


85.5%


87.2%

Occupancy rate – in-place (period-end)


81.7%


82.9%


85.8%

Average in-place and committed net rent per square foot (period-end)

$

23.25


$

23.25


$

23.26

Weighted average lease term (“WALT”) (years)


5.4


5.2


5.0

See footnotes at end.


Three months ended


March 31,


March 31,


2022


2021

Operating results


Net income

$

52,282


10,146

Funds from operations (“FFO”)(3)


21,043


21,309

Net rental income


25,863


26,271

Comparative properties net operating income (“NOI”)(4)


27,320


28,710

Per unit amounts


FFO (diluted)(5)

$

0.39


0.38

Distribution rate


0.25


0.25

See footnotes at end.

“Our business has continued to navigate through uncertainties in the economy and recovery from the pandemic with resilience,” said Michael Cooper, Chief Executive Officer of Dream Office REIT. “We think our strategy of focusing on our best assets to improve their quality, reducing carbon emissions, animating the retail and common areas and making our office communities more inclusive will be very well received by our tenants as they return to work and will add value to the portfolio.”

  • Net income for the quarter: For the three months ended March 31, 2022, the Trust generated net income of $52.3 million. Included in net income for the three months ended March 31, 2022 are net rental income totalling $25.9 million, share of net income from investment in Dream Industrial REIT totalling $42.9 million and positive fair value adjustments to investment properties totalling $19.4 million primarily due to fair value gains at four properties valued by qualified external valuation professionals. Partially offsetting these items were negative fair value adjustments to financial instruments for the three months ended March 31, 2022 totalling $20.3 million primarily due to the revaluation of the subsidiary redeemable units as a result of appreciation in the Trust’s unit price.
  • Diluted FFO per unit(5) for the quarter: For the three months ended March 31, 2022, diluted FFO per unit increased to $0.39 per unit relative to $0.38 per unit in Q1 2021 as NOI from our completed development at 1900 Sherwood Place in Regina (+$0.02), higher FFO from our investment in Dream Industrial REIT (+$0.02) and the effect of accretive unit repurchases under our Normal Course Issuer Bid (“NCIB”) program (+$0.01) were partially offset by lower comparative properties NOI (-$0.03) and other items (-$0.01).
  • Net rental income for the quarter: Net rental income for the three months ended March 31, 2022 decreased by $0.4 million relative to the prior year comparative quarter primarily due to lower weighted average occupancy in Toronto downtown and lower rents on renewals and new leases in the regions that we collectively refer to as Other markets, comprising our properties located in Calgary, Saskatchewan, Mississauga, Scarborough and the United States. Partially offsetting the year-over-year decrease were net rental income from our completed property under development at 1900 Sherwood Place in Regina, higher net rents on renewals and new leasing in Toronto downtown and higher parking revenues.
  • Comparative properties NOI(4) for the quarter: For the three months ended March 31, 2022, comparative properties NOI decreased by 4.8%, or $1.4 million, over the prior year comparative quarter, primarily driven by declines in weighted average occupancy in Toronto downtown and lower in-place rents in the Other markets region. Partially offsetting the declines were higher rates on renewals and new leases in Toronto downtown, higher weighted average occupancy in the Other markets region and favourable parking revenues of $0.2 million across the portfolio.

    Over the course of the COVID-19 pandemic, we saw significant reductions in leasing activity and building traffic relative to historical norms, leading to declines in occupancy and parking income as a result of repeated states of emergency in Toronto. Despite the public health measures enacted in response to the Omicron variant in December 2021 and January 2022, we continue to anticipate that many companies will return their employees to the office during 2022 and, with that, leasing activity and traffic flow to our properties will improve and our comparative properties NOI and parking revenues will begin to normalize.

    We are actively managing our assets in the Toronto downtown region, which represent 82% of our active portfolio investment property fair values, to improve the quality of the buildings and to continue to improve rental rates in this market. For our assets in the Other markets region, which make up the remaining 18% of our total portfolio investment properties fair value, we are repositioning these assets to improve occupancy and liquidity in the private market.

  • In-place occupancy: Total portfolio in-place occupancy on a quarter-over-quarter basis decreased by 1.2% relative to Q4 2021 to 81.7%. In Toronto downtown, 95,000 square feet of early terminations and 42,000 square feet of expiries were partially offset by 19,000 square feet of new leasing activity and 10,000 square feet of renewals. Within the 95,000 square feet of early terminations, 80,000 square feet relates to a negotiated tenant downsize on renewal for a lease expiring in Q4 2022. The Trust has leased 54,000 square feet of the returned space for a ten-year term commencing in the first half of 2023 with a leading provider of flexible workspace for enterprise clients for its first Canadian location and is in advanced negotiations for a further 13,000 square feet of the remaining space. Under the terms of the lease, the Trust is entitled to a share of the tenant’s net revenues plus additional rents. The Trust expects to achieve revenues from the space equal to or higher than the equivalent market rental rate on a stabilized basis. The renewing tenant retained 82,000 of its 139,000 square feet for a period of ten years with initial rents on the retained space 36% higher than expiring rates with progressive rent steps to a 68% increase over expiring rates by the end of the term. The remaining 57,000 square feet of space is currently sublet and the Trust is in advanced negotiations with those subtenants for 45,000 square feet of the subleased space. The Trust is actively marketing the remaining 25,000 square feet to prospective tenants.

    In the Other markets region, 53,000 square feet of new leasing activity and 13,000 square feet of renewals were partially offset by 23,000 square feet of expiries.

    Total portfolio in-place occupancy on a year-over-year basis decreased from 85.8% at Q1 2021 to 81.7% this quarter due to net negative absorption in Toronto downtown partially offset by the reclassification of 1900 Sherwood Place to active properties in Q3 2021 and net positive absorption in Other markets during Q4 2021 and Q1 2022.

  • Lease commencements for the quarter: For the three months ended March 31, 2022, 71,000 square feet of leases commenced, not including temporary leases. In Toronto downtown, 22,000 square feet of leases commenced at $35.13 per square foot, or 28.3% higher than the previous rent in the same space. In the Other markets region, 49,000 square feet of leases commenced at $11.43 per square foot or 35.5% lower than the previous rents in the same space as rental rates on new and renewed leasing rolled down to market rates. The renewal and relocation rate to expiring rate spread for the three months ended March 31, 2022 was 4.7% above expiring rates on 23,000 square feet of renewals.
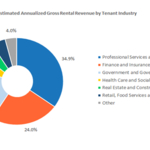
  • Tenant profile: As illustrated in the chart below, the Trust has a diversified and stable tenant mix.

    See Figure 1, Estimated Annualized Gross Rental Revenue by Tenant Industry

    Our top ten tenants make up approximately 38% of gross rental revenue, and 50% of our top tenants have credit ratings of A- or higher.

BUSINESS UPDATE

As at March 31, 2022, the Trust had approximately $280 million of available liquidity(6), $170 million of unencumbered assets(7) and a level of debt (net total debt-to-net total assets)(8) of 41.9%. As at March 31, 2022, the Trust had $2.6 billion of investment properties, $8.3 million of cash and cash equivalents, $271.3 million of undrawn credit facilities, $3.1 billion of total assets and $1.3 billion of total debt.

The novel coronavirus (“COVID-19”) pandemic continues to disrupt the Canadian economy. Repeated states of emergency and lockdowns as a result of emerging variants, most recently public health measures due to the Omicron variant in December 2021 and January 2022, have made it difficult for businesses to plan for the future. The full impact that these disruptions will have on the market for office space in the near term and the wider economy in general is unclear and difficult to predict. However, we believe that there will continue to be demand for high-quality and well-located office space in urban markets in Canada, especially in Toronto, when the economy normalizes. The Trust has ample financial resources to absorb near-term operational challenges and a program to drive value in the business through capital improvements and redevelopments to deliver best-in-class boutique office space to our tenants.

The COVID-19 pandemic delayed the construction timelines for the planned Bay Street corridor revitalization, but we are near completion of the interior renovation work, and façade improvements are scheduled to be finished this year. Since 2020, our successful redevelopment program has completed two projects on time and on budget that have significantly increased the value of the redeveloped properties and delivered significant incremental income to the Trust. 357 Bay Street in Toronto downtown was completed in Q4 2020 and in Q1 2022 contributed $3.0 million of annualized comparative properties NOI. Q3 2021 marked the completion of 1900 Sherwood Place in Regina, Saskatchewan, and the commencement of the 25-year Co-operators lease at the property. 1900 Sherwood Place generated $5.2 million of annualized NOI over Q1 2022. We are currently in the process of revitalizing 366 Bay Street in Toronto by fully modernizing the building’s systems, improving the building’s floorplates and upgrading the quality of the common areas. We are targeting a LEED Gold certification, among other certifications, as part of this development project. In addition, we have received zoning approval for 250 Dundas Street West in Toronto, have a zoning application underway for our property at Eglinton Avenue East and Birchmount Road in Scarborough, and are working on a development plan for 212 and 220 King Street West in Toronto.

We hold a stake in Dream Industrial REIT which continues to provide a meaningful contribution to our FFO as a result of the REIT’s successful European expansion and value-add strategy and the monthly distributions provide steady, predictable cash flow to the Trust at a time of uncertainty.

The effect of public health measures put in place as a response to the Omicron variant resulted in fewer property tours, lower building traffic and reduced parking lot utilization relative to Q4 2021. However, we believe that these effects are transitory and that the improvements in the latter half of 2021 will re-emerge during 2022.

During Q1 2022, the Trust executed leases totalling approximately 159,000 square feet across our portfolio. In Toronto downtown, the Trust executed 131,000 square feet of leases including the 54,000 square foot flexible workspace lease discussed previously. The remaining 78,000 square feet of leases were executed at a weighted average net rent of $32.07 per square foot, or 26.0% higher than the weighted average prior net rent per square foot on the same space, with a weighted average lease term of 5.2 years.

In the Other markets region we executed leases totalling 28,000 square feet at a weighted average net rent of $19.42 per square foot, an increase of 0.7% from the weighted average prior net rent on the same space, with a weighted average lease term of 7.2 years. To date, the Trust has secured commitments for approximately 659,000 square feet, or 82%, of 2022 full-year natural lease expiries, consistent with pre-COVID leasing trends. In Toronto downtown, 63,000 square feet, or approximately 1.8% of the region’s gross leaseable area, was being held intentionally vacant for retail repositioning and property improvement purposes as at March 31, 2022 of which the Trust has deals that were subsequently completed, are conditional or are in an advanced state of negotiation totalling 19,000 square feet.

Approximately 2% of the Trust’s total portfolio is currently sublet, with a weighted average in-place net rent of just over $25 per square foot.

The following table summarizes selected operational statistics with respect to the trailing four quarters and the month of April 2022 as at May 5, 2022, all presented as a percentage of recurring contractual gross rent:


Cash

Deferral


collected

arrangements*

Outstanding

Q2 2021

98.4%

0.3%

1.3%

Q3 2021

98.5%

0.2%

1.3%

Q4 2021

98.4%

—%

1.6%

Q1 2022

97.8%

—%

2.2%

April 2022

98.0%

0.1%

1.9%

* Deferral arrangements are presented net of subsequently received cash receipts.

Over the course of the COVID-19 pandemic, we have worked collaboratively with our tenants to help them manage the challenges within their businesses and be set up for long-term success when the pandemic has passed. The Canadian Emergency Rent Subsidy program ended during Q4 2021 and the Hardest-Hit Business Recovery Program was introduced. While the new program is harder for tenants to qualify for, we have not seen any significant change in rent collection patterns since its introduction. In certain instances, the Trust has granted deferrals and rent repayment arrangements to select tenants on a case-by-case basis.

For the three months ended March 31, 2022, the Trust recorded COVID-related provisions totalling approximately $0.6 million which are included in the line item “COVID-related provisions and adjustments” within net rental income. These provision balances represent an estimate of potential credit losses on our trade receivables for all uncollected rent during the three months ended March 31, 2022.

CAPITAL HIGHLIGHTS

KEY FINANCIAL PERFORMANCE METRICS


As at

(unaudited)


March 31,


December 31,


2022


2021

Financing


Weighted average face rate of interest on debt (period-end)(9)


3.37%


3.28%

Interest coverage ratio (times)(10)


2.9


3.0

Net total debt-to-normalized adjusted EBITDAFV ratio (years)(11)


10.4


9.8

Level of debt (net total debt-to-net total assets)(8)


41.9%


41.8%

Average term to maturity on debt (years)


3.4


3.6

Undrawn credit facilities, available liquidity and unencumbered assets


Undrawn credit facilities

$

271.3

$

192.4

Available liquidity (in millions)(6)


279.6


201.1

Unencumbered assets (in millions)(7)


169.6


178.3

Capital (period-end)


Total number of REIT A and LP B units (in millions)(12)


52.3


53.3

Net asset value (“NAV”) per unit(13)

$

32.63

$

31.49

See footnotes at end.

  • Canada Infrastructure Bank Commercial Building Retrofit Initiative: On March 31, 2022, the Trust entered into an unsecured non-revolving credit facility and term credit facility with the Canada Infrastructure Bank under its Commercial Building Retrofit Initiative. Under the facility, the Canada Infrastructure Bank will lend the trust up to $112.9 million, representing 80% of the cost of commercial property retrofits in order to achieve certain energy efficiency savings and greenhouse gas (“GHG”) emission reductions. The non-revolving credit facility is available until the earlier of March 31, 2027 or the completion of all funded projects, at which point the aggregate drawings are converted to a 20-year amortizing term credit facility. During the five-year non-revolving credit facility period, the accumulated drawings bear interest at an annual fixed rate of 2.147%. Subsequent to conversion, the 20-year amortizing term credit facility will bear interest at an annual fixed rate between 1.0% and 3.0% determined at the time of conversion based on the assessed GHG emission reductions achieved in aggregate with the financed projects.
  • Normal Course Issuer Bid (“NCIB”): For the three months ended March 31, 2022, the Trust purchased for cancellation 1,036,163 REIT A Units under the NCIB at a cost of $26.5 million. The Trust’s current NCIB program is now complete.
  • NAV per unit(13): As at March 31, 2022, our NAV per unit increased to $32.63 when compared to $31.49 at December 31, 2021. The increase in NAV per unit relative to December 31, 2021 was primarily due to cash flow retention (diluted FFO net of distributions), fair value gains on investment properties in Toronto downtown for four properties valued by qualified external valuation professionals, incremental income from our investment in Dream Industrial REIT and the effect of accretive unit repurchases under our NCIB program. As at March 31, 2021, equity per the condensed consolidated financial statements was $1.6 billion.

“Our partnership with the Canada Infrastructure Bank provides the Trust with a great source of capital to continue to improve our assets to a higher standard while doing our part to reduce greenhouse gas emissions in our portfolio,” said Jay Jiang, Chief Financial Officer of Dream Office REIT. “The facility will also enhance our liquidity and flexibility of our balance sheet so that we are able to reduce risk while remaining opportunistic.”

CONFERENCE CALL

Dream Office REIT holds semi-annual conference calls following the release of second and fourth quarter results.

OTHER INFORMATION

Information appearing in this press release is a selected summary of results. The condensed consolidated financial statements and Management’s Discussion and Analysis (“MD&A”) of the Trust are available at www.dreamofficereit.ca and on www.sedar.com.

Dream Office REIT is an unincorporated, open-ended real estate investment trust. Dream Office REIT is a premier office landlord in downtown Toronto with over 3.5 million square feet owned and managed. We have carefully curated an investment portfolio of high-quality assets in irreplaceable locations in one of the finest office markets in the world. We intend to enhance these properties to elevate their desirability to tenants and investors and improve the overall community experience. For more information, please visit our website at www.dreamofficereit.ca.

FOOTNOTES

(1)

Excludes joint ventures that are equity accounted at the end of each period.

(2)

Excludes properties under development and joint ventures that are equity accounted at the end of each period.

(3)

FFO is a non-GAAP financial measure. The most directly comparable financial measure to FFO is net income. The tables included in the Appendices section of this press release reconcile FFO for the three months ended March 31, 2022 and March 31, 2021 to net income. For further information on this non-GAAP measure please refer to the statements under the heading “Non-GAAP Financial Measures, Ratios and Supplementary Financial Measures” in this press release.

(4)

Comparative properties NOI is a non-GAAP financial measure. The most directly comparable financial measure to comparative properties NOI is net rental income. The tables included in the Appendices section of this press release reconcile comparative properties NOI for the three months ended March 31, 2022 and March 31, 2021 to net rental income. For further information on this non-GAAP measure please refer to the statements under the heading “Non-GAAP Financial Measures, Ratios and Supplementary Financial Measures” in this press release.

(5)

Diluted FFO per unit is a non-GAAP ratio. Diluted FFO per unit is calculated as FFO (a non-GAAP financial measure) divided by weighted average number of units. For further information on this non-GAAP ratio, please refer to the statements under the heading “Non-GAAP Financial Measures, Ratios and Supplementary Financial Measures” in this press release. A description of the determination of the weighted average number of units can be found in the Trust’s Management’s Discussion and Analysis for the three months ended March 31, 2022 in the section “Supplementary Financial Measures and Other Disclosures” under the heading “Weighted average number of units”.

(6)

Available liquidity is a non-GAAP financial measure. The most directly comparable financial measure to available liquidity is undrawn credit facilities. The tables included in the Appendices section of this press release reconcile available liquidity to undrawn credit facilities as at March 31, 2022 and December 31, 2021. For further information on this non-GAAP financial measure please refer to the statements under the heading “Non-GAAP Financial Measures, Ratios and Supplementary Financial Measures” in this press release.

(7)

Unencumbered assets is a supplementary financial measure. For further information on this supplementary financial measure, please refer to the statements under the heading “Non-GAAP Financial Measures, Ratios and Supplementary Financial Measures” in this press release.

(8)

Level of debt (net total debt-to-net total assets) is a non-GAAP ratio. Net total debt-to-net total assets comprises net total debt (a non-GAAP financial measure) divided by net total assets (a non-GAAP financial measure). The tables in the appendices section reconcile net total debt and net total assets to total debt and total assets, respectively, as at March 31, 2022 and December 31, 2021. For further information on this non-GAAP ratio, please refer to the statements under the heading “Non-GAAP Financial Measures, Ratios and Supplementary Financial Measures” in this press release.

(9)

Weighted average face rate of interest on debt is calculated as the weighted average face rate of all interest-bearing debt balances excluding debt in joint ventures that are equity accounted.

(10)

Interest coverage ratio (times) is a non-GAAP ratio. Interest coverage ratio comprises trailing 12-month adjusted EBITDAFV divided by trailing 12-month interest expense on debt. Adjusted EBITDAFV, trailing 12-month Adjusted EBITDAFV and trailing 12-month interest expense on debt are non-GAAP measures. The tables in the Appendices section reconcile adjusted EBITDAFV to net income for the three months ended March 31, 2022 and March 31, 2021 and for the year ended December 31, 2021 and trailing 12-month adjusted EBITDAFV and trailing 12-month interest expense to adjusted EBITDAFV and interest expense, respectively, for the trailing 12-month period ended March 31, 2022. For further information on this non-GAAP ratio, please refer to the statements under the heading “Non-GAAP Financial Measures and Ratios and Supplementary Financial Measures” in this press release.

(11)

Net total debt-to-normalized adjusted EBITDAFV ratio (years) is a non-GAAP ratio. Net total debt-to-normalized adjusted EBITDAFV comprises net total debt (a non-GAAP financial measure) divided by normalized adjusted EBITDAFV (a non-GAAP financial measure). Normalized adjusted EBITDAFV comprises adjusted EBITDAFV (a non-GAAP measure) adjusted for NOI from sold properties in the quarter. For further information on this non-GAAP ratio, please refer to the statements under the heading “Non-GAAP Financial Measures and Ratios and Supplementary Financial Measures” in this press release.

(12)

Total number of REIT A and LP B units includes 5.2 million LP B Units which are classified as a liability under IFRS.

(13)

NAV per unit is a non-GAAP ratio. NAV per unit is calculated as Total equity (including LP B Units) divided by the total number of REIT A and LP B units outstanding as at the end of the period. Total equity (including LP B Units) is a non-GAAP measure. The most directly comparable financial measure to total equity (including LP B Units) is equity. The tables included in the appendices section of this press release reconcile total equity (including LP B Units) to equity as at March 31, 2022 and December 31, 2021. For further information on this non-GAAP measure please refer to the statements under the heading “Non-GAAP Financial Measures, Ratios and Supplementary Financial Measures” in this press release.

Contacts

Michael J. Cooper
Chairman and Chief Executive Officer

(416) 365-5145

mcooper@dream.ca

Jay Jiang
Chief Financial Officer

(416) 365-6638

jjiang@dream.ca

Read full story here

Blue Point and Concrete Industry Platform SASE Company Cement Growth-Focused Partnership With Bartell Global

May 6, 2022 By Business Wire

CHARLOTTE, N.C.–(BUSINESS WIRE)–Blue Point Capital Partners and its BPCP III concrete industry platform, SASE Company, are pleased to announce the addition of Bartell Global, a provider of concrete finishing, site preparation and surface preparation equipment and consumables.

Headquartered in Mississauga, Ontario, Bartell offers a comprehensive portfolio of products covering the entire concrete flooring lifecycle. Together, SASE and Bartell are strategically positioned to expand geographic presence and industry leadership in high-caliber products for commercial, residential, industrial and retail concrete flooring applications.

“For over 75 years, our customers have trusted the Bartell team to deliver quality equipment, innovative products and excellent service,” said Bartell CEO John Locke. “We have met our cultural match in the SASE and Blue Point teams. This growth-focused partnership opens new doors for the employees and customers of both companies, strategically expanding the product portfolio and geographic footprint that allow us to uphold our high customer care standards.”

“This is a powerhouse combination with scaling potential in almost every aspect of the business,” said SASE CEO Karl Moritz. “From the creation of new products to expanding into new regions, this collaboration represents significant opportunities for growth.”

The combined company will extend its geographic reach throughout the U.S., Canada, the U.K., Europe and Asia, enabling it to offer more solutions and support to a broad spectrum of contractors around the world.

“In addition to our organic value creation efforts—most notably through the support of our Asia supply chain team—M&A has been a critical part of our strategy for SASE since the inception of our partnership,” said Blue Point Partner Brian Castleberry. “These businesses have excellent cultural and strategic alignment, which has created instant opportunities for expansion.”

Bartell Global (www.bartellglobal.com) is made up of five premium brands that have rich histories in the concrete finishing, site preparation, and surface preparation industries. These brands are leaders in developing innovative and industry-leading products and work together to create a unified company. Since 1946, Bartell has aimed to continually push the envelope regarding innovation and customer service.

SASE (www.sasecompany.com) is a provider of polished concrete equipment and consumables in the United States. SASE assembles and distributes branded equipment, consumables and spare parts used in the concrete polishing process. SASE’s comprehensive portfolio includes high-quality products such as grinding machines, floor scrapers, vacuums, diamond tooling, abrasives, chemicals, dyes and related products.

Blue Point Capital Partners (www.bluepointcapital.com) is a private equity firm managing over $1.5 billion in committed capital. With offices in Cleveland, Charlotte, Seattle and Shanghai, Blue Point’s geographical footprint allows it to establish relationships with local and regional entrepreneurs and advisors while providing the perspectives and resources of a global organization. Blue Point has over a two-decade history of partnering with lower middle-market businesses to build processes and capabilities to achieve dramatic growth. The firm focuses on opportunities where it can leverage its collective experience, extensive network of operating resources and focused add-on acquisition efforts as well as its unique toolkit, which includes supply chain/Asian capabilities, improved digital marketing or data strategies, and talent acquisition and diversification efforts. Blue Point typically invests in businesses that generate between $30 million and $300 million in revenue.

Contacts

Blue Point Capital Partners
Megan Kneipp

Managing Director, Business Development

mkneipp@bluepointcapital.com

Brian Castleberry

Partner

bcastleberry@bluepointcapital.com

MiddleM Creative (Media Inquiries)
Allie Gamble

Vice President

allie@middlemcreative.com

Home Capital Declares Common Share Dividend

May 5, 2022 By Business Wire

TORONTO–(BUSINESS WIRE)–Home Capital Group Inc. (“Home Capital” or “the Company”) (TSX: HCG) today announced that its Board of Directors declared a common share dividend of $0.15 per share for the second quarter 2022. The dividend is payable on June 15, 2022 to shareholders of record on May 31, 2022. The dividend is designated as an “eligible” dividend for the purposes of the Income Tax Act (Canada) and any similar provincial legislation.

About Home Capital

Home Capital Group Inc. is a public company, traded on the Toronto Stock Exchange (HCG), operating through its principal subsidiary, Home Trust Company. Home Trust is a federally regulated trust company offering residential and non-residential mortgage lending, securitization of residential mortgage products, consumer lending and credit card services. In addition, Home Trust and its wholly owned subsidiary, Home Bank, offer deposits via brokers and financial planners, and through a direct-to-consumer brand, Oaken Financial. Licensed to conduct business across Canada, we have offices in Ontario, Alberta, British Columbia, Nova Scotia, and Quebec.

Contacts

Jill MacRae

VP, Investor Relations and ESG

(416) 933-4991

investor.relations@hometrust.ca

Home Capital Reports First Quarter 2022 Results

May 5, 2022 By Business Wire

Double-digit loan growth driven by 72% increase in originations

TORONTO–(BUSINESS WIRE)–Home Capital Group Inc. (“Home Capital” or “the Company”) (TSX: HCG) today reported financial results for the three months ended March 31, 2022. This press release should be read in conjunction with the Company’s 2022 First Quarter Report including Financial Statements and Management’s Discussion and Analysis which are available on Home Capital’s website at www.homecapital.com and on SEDAR at www.sedar.com.

“We are starting off with good momentum in growing our mortgage book including record originations in our Classic single-family mortgages,” said Yousry Bissada, President and Chief Executive Officer. “We are pleased with the rate of our asset growth. The assets we add now will generate income well into the future. Although our net interest margin fell this quarter due to increases in our cost of funds outpacing increases in mortgage rates, we expect to benefit over time from margin increases as spreads normalize.”

Net Income: Diluted earnings per share of $1.02 in Q1 2022 compared with $1.24 in Q1 2021

  • Net income of $44.7 million or $1.02 diluted earnings per share in Q1 2022, a decrease of 1.9% from $1.04 per share in Q4 2021 and a decrease of 17.7% from $1.24 per share in Q1 2021.
  • Net interest margin of 2.18% in Q1 2022, compared with 2.46% in Q4 2021 and 2.61% in Q1 2021.
  • Non-interest expenses of $65.0 million in Q1 2022, compared with $61.7 million in Q4 2021 and $64.1 million in Q1 2021.

Asset Growth: Mortgage originations increased 72.5% over Q1 2021

  • Mortgage originations of $2.76 billion in Q1 2022, compared with $2.72 billion in Q4 2021 and $1.60 billion in Q1 2021.
  • Single-family mortgage originations of $2.30 billion in Q1 2022, compared with $2.27 billion in Q4 2021 and $1.33 billion in Q1 2021.
  • Total loan portfolio of $19.47 billion at the end of Q1 2022, an increase of 5.6% from the end of Q4 2021 and 12.7% from the end of Q1 2021.
  • Loans under administration of $25.37 billion at the end of Q1 2022, up 5.0% from the end of Q4 2021 and 11.4% from the end of Q1 2021.

Funding: Deposits through our Oaken channel of $4.53 billion make up 31.5% of total deposits

  • Total deposits of $14.39 billion at the end of Q1 2022, compared with $14.01 billion at the end of Q4 2021 and $13.77 billion at the end of Q1 2021.
  • Total Oaken deposits of $4.53 billion at the end of Q1 2022, an increase of 3.3% from the end of Q4 2021 and 11.5% from the end of Q1 2021.
  • Oaken’s share of total deposits was 31.5% at the end of Q1 2022, compared with 31.3% at the end of Q4 2021 and 29.5% at the end of Q1 2021.

Credit Quality: Reversal of credit provisions of $0.1 million compared to $12.1 million in Q1 2021

  • Reversal of provision for credit losses (“PCL”) of $0.1 million in Q1 2022, compared with a provision expense of $1.0 million in Q4 2021 and a reversal of provision for credit losses of $12.1 million in Q1 2021.
  • Allowance for credit losses of 0.18% of gross loans at the end of Q1 2022, compared with 0.20% at the end of Q4 2021 and 0.34% at the end of Q1 2021.
  • Net write-offs as a percentage of gross loans were 0.01% in Q1 2022, compared to less than one basis point in Q4 2021 and 0.01% in Q1 2021.
  • Net non-performing loans (represented by Stage 3 loans under IFRS 9) as a percentage of gross loans at 0.11% at the end of Q1 2022, compared with 0.13% at the end of Q4 2021 and 0.38% at the end of Q1 2021. 

Outlook

“We have actively managed down our CET1 capital since the beginning of the year through a combination of asset growth, dividend payment and strategic share repurchases,” affirmed Mr. Bissada. “We are on track to achieve our near-term target capital range of 14 to 15% CET1.”

First Quarter 2022 Results Conference Call and Webcast

The conference call and webcast will take place on Wednesday, May 4, 2022, at 8:00 a.m. ET. Participants may register in advance by visiting this link. The call will also be accessible in listen-only mode on Home Capital’s website at www.homecapital.com in the Investor Relations section of the website. The archived audio webcast will be available for 90 days on Home Capital’s website at www.homecapital.com.

Financial Highlights


For the three months ended

(000s, except Percentage and Per Share Amounts)

March 31


December 31


March 31


2022


2021


2021

INCOME STATEMENT HIGHLIGHTS1


Net Interest Income

$

112,974


$

120,996


$

125,936

Net Interest Margin


2.18%


2.46%


2.61%

Efficiency Ratio


51.7%


45.9%


45.9%


Provision as a Percentage of Gross Loans (annualized)


0.00%


0.02%


(0.28)%

Net Write-Offs as a Percentage of Gross Loans (annualized)


0.01%


0.00%


0.01%


Net Income

$

44,718


$

52,664


$

64,503

Diluted Earnings per Share

$

1.02


$

1.04


$

1.24

Return on Shareholders’ Equity (annualized)


11.3%


12.4%


15.2%

ORIGINATIONS1


Total Mortgage Originations

$

2,760,819


$

2,722,079


$

1,600,418

Single-Family Residential Mortgage Originations


2,297,895


2,273,322


1,327,988


As at


March 31


December 31


March 31


2022


2021


2021

BALANCE SHEET HIGHLIGHTS1


Total Assets

$

21,163,844


$

20,146,954


$

18,952,048

Total Assets Under Administration2


27,038,525


25,802,433


24,447,737

Total Loan Portfolio3


19,466,546


18,428,802


17,275,610

Total Loans Under Administration2


25,372,967


24,154,206


22,772,565

Deposits


14,393,077


14,013,372


13,769,162

FINANCIAL STRENGTH1


Capital Measures4


Common Equity Tier 1 Capital Ratio


17.58%


18.43%


21.01%

Leverage Ratio


6.90%


7.19%


8.28%


Credit Quality


Net Non-Performing Loans as a Percentage of Gross Loans


0.11%


0.13%


0.38%

NPL Allowance as a Percentage of Gross NPL5


20.9%


22.8%


16.5%


Share Information


Book Value per Common Share

$

37.45


$

36.55


$

33.85

Dividend paid during the period ended

$

0.15


$

–


$

–

Number of Common Shares Outstanding


42,601


42,986


50,842

1 Please see the Glossary in the Company’s 2022 First Quarter Report for additional information on various measures presented in this table.

2 Total assets and loans under administration include both on- and off-balance sheet amounts. Total on-balance sheet loans include loans held for sale and are presented gross of allowance for credit losses.

3 Total loan portfolio is presented gross of allowance for credit losses and excludes loans held for sale.

4 These figures relate to the Company’s operating subsidiary, Home Trust Company.

5 NPL indicates non-performing loans, defined as Stage 3 loans under IFRS 9 Financial Instruments. See definition of impaired or non-performing loans under Glossary in the Company’s 2022 First Quarter Report.

Caution Regarding Forward-Looking Statements

From time to time, Home Capital Group Inc. makes written and verbal forward-looking statements. These are included in the Annual Report, periodic reports to shareholders, regulatory filings, press releases, Company presentations and other Company communications. Forward-looking statements are made in connection with business objectives and targets, Company strategies, operations, anticipated financial results and the outlook for the Company, its industry, and the Canadian economy. These statements regarding expected future performance are “financial outlooks” within the meaning of National Instrument 51-102. Please see the risk factors, which are set forth in detail in the Risk Management section of the 2022 First Quarter Report, as well as the Company’s other publicly filed information, which is available on the System for Electronic Document Analysis and Retrieval (SEDAR) at www.sedar.com, for the material factors that could cause the Company’s actual results to differ materially from these statements. These risk factors are material risk factors a reader should consider, and include credit risk, liquidity and funding risk, structural interest rate risk, operational risk, investment risk, strategic risk, reputational risk, compliance risk and capital adequacy risk along with additional risk factors that may affect future results. Forward-looking statements can be found in the Report to the Shareholders and the Outlook section of the 2022 First Quarter Report. Forward-looking statements are typically identified by words such as “will,” “believe,” “expect,” “anticipate,” “intend,” “should,” “estimate,” “plan,” “forecast,” “may,” and “could” or other similar expressions.

By their very nature, these statements require the Company to make assumptions and are subject to inherent risks and uncertainty, general and specific, which may cause actual results to differ materially from the expectations expressed in the forward-looking statements. These risks and uncertainties include, but are not limited to, the impacts of the COVID-19 pandemic and government responses to it, global capital market activity, changes in government monetary and economic policies, changes in interest rates, inflation levels and general economic conditions, legislative and regulatory developments, climate change, competition and technological change. The preceding list is not exhaustive of possible factors.

These and other factors should be considered carefully and readers are cautioned not to place undue reliance on these forward-looking statements. The Company presents forward-looking statements to assist shareholders in understanding the Company’s assumptions and expectations about the future that are relevant in management’s setting of performance goals, strategic priorities and outlook. The Company presents its outlook to assist shareholders in understanding management’s expectations on how the future will impact the financial performance of the Company. These forward-looking statements may not be appropriate for other purposes. The Company does not undertake to update any forward-looking statements, whether written or verbal, that may be made from time to time by it or on its behalf, except as required by securities laws.

Assumptions about the performance of the Canadian economy in 2022 and its effect on Home Capital’s business are material factors the Company considers when setting strategic priorities and outlook. In determining expectations for economic growth, both broadly and in the financial services sector, the Company primarily considers historical and forecasted economic data provided by the Canadian government and its agencies and other third-party providers. In setting and reviewing its strategic priorities and outlook for 2022, management makes certain assumptions about the Canadian economy, employment conditions, interest rates, levels of housing activity, household debt service levels and the Company’s continued access to broker mortgage and deposit markets. These assumptions are discussed in greater detail in the 2022 First Quarter Report.

The global pandemic related to the outbreak of COVID-19 significantly impacts these assumptions. Updated forward-looking macroeconomic assumptions have been incorporated into the models used in the Company’s expected credit loss estimation process. Please see Note 5(C) to the unaudited interim consolidated financial statements included in the Company’s 2022 First Quarter Report for more information on these assumptions. The full extent of the impact that COVID-19, including government and/or regulatory responses to the outbreak, will have on the Canadian economy and the Company’s business remains uncertain and difficult to predict. Please see the Outlook and the Risk Management sections in the Management’s Discussion and Analysis included in the 2022 First Quarter Report for more information.

Regulatory Filings

The Company’s continuous disclosure materials, including interim filings, annual Management’s Discussion and Analysis and audited consolidated financial statements, Annual Information Form, Notice of Annual Meeting of Shareholders, and Proxy Circular are available on the Company’s website at www.homecapital.com and on the Canadian Securities Administrators’ website at www.sedar.com.

About Home Capital

Home Capital Group Inc. is a public company, traded on the Toronto Stock Exchange (HCG), operating through its principal subsidiary, Home Trust Company. Home Trust is a federally regulated trust company offering residential and non-residential mortgage lending, securitization of residential mortgage products, consumer lending and credit card services. In addition, Home Trust and its wholly owned subsidiary, Home Bank, offer deposits via brokers and financial planners, and through a direct-to-consumer brand, Oaken Financial. Licensed to conduct business across Canada, we have offices in Ontario, Alberta, British Columbia, Nova Scotia, and Quebec.

Contacts

Jill MacRae

VP, Investor Relations and ESG

(416) 933-4991

investor.relations@hometrust.ca

The AZEK Company Announces Term Loan Refinancing

May 4, 2022 By Business Wire

CHICAGO–(BUSINESS WIRE)–The AZEK Company Inc. (NYSE: AZEK) (“AZEK” or the “Company”), the industry-leading manufacturer of beautiful, low-maintenance and environmentally sustainable outdoor living products, including TimberTech® decking, Versatex® and AZEK Trim®, and StruXure™ pergolas, today announced the entry into a new first lien term loan credit agreement (the “New Credit Agreement”) with Bank of America, N.A., as administrative agent and collateral agent, and the lenders and financial institutions party thereto. The New Credit Agreement provided the Company with a $600 million first lien term loan facility (the “Credit Facility”), the proceeds of which were applied, among other uses, to prepay the obligations in full under the Company’s existing first lien term loan credit agreement, which was due in May 2024 (the “Existing Credit Agreement”). In connection with the entry into the New Credit Agreement, the Existing Credit Agreement was terminated.

The Credit Facility will mature in April 2029, subject to acceleration or prepayment. Commencing on December 31, 2022, the Credit Facility will amortize in equal quarterly installments of 0.25% of the aggregate principal amount of the loans outstanding, subject to reduction for certain prepayments.

The interest rate applicable to loans under the Credit Facility will be based on Term SOFR for the applicable interest period at AZEK’s option, plus an applicable margin of 2.50%.

“We are pleased to announce the closing of this refinancing which provides additional liquidity, strengthens AZEK’s financial position and improves our capital structure to support our future growth ambitions,” said AZEK CFO Peter Clifford. “We believe the successful completion of this transaction on favorable terms reflects the recognition by the credit market of the significant achievements we have made in executing our growth strategy as well as our continued maturation as a public company.”

In connection with the closing of the Credit Facility, the Company also received a corporate credit rating of BB- from S&P Global Ratings, which is an upgrade from its prior rating.

About The AZEK® Company

The AZEK Company Inc. (NYSE: AZEK) is the industry-leading designer and manufacturer of beautiful, low maintenance and environmentally sustainable outdoor living products, including TimberTech® decking and Versatex® AZEK Trim® and StruXure™ pergolas. Consistently recognized as the market leader in innovation, quality and aesthetics, products across AZEK’s portfolio are made from up to 100% recycled material and primarily replace wood on the outside of homes, providing a long-lasting, eco-friendly, and stylish solution to consumers. Leveraging the talents of its approximately 2,000 employees and the strength of relationships across its value chain, The AZEK Company is committed to accelerating the use of recycled material in the manufacturing of its innovative products, keeping millions of pounds of waste out of landfills each year, and revolutionizing the industry to create a more sustainable future. Headquartered in Chicago, Illinois, the company operates manufacturing facilities in Ohio, Pennsylvania, Georgia, and Minnesota, and recently announced a new facility will open in Boise, Idaho. For additional information, please visit azekco.com.

Cautionary Note Regarding Forward-Looking Statements

This release contains or refers to certain forward-looking statements within the meaning of the federal securities laws and subject to the “safe harbor” protections thereunder. Forward-looking statements are statements about future events and are based on our current expectations. These forward-looking statements may be identified by the words “believe,” “hope,” “expect,” “intend,” “will,” “target,” “anticipate,” “goal” and similar expressions. Projected financial information and performance are forward-looking statements. Other forward-looking statements may include, without limitation, statements with respect to our future financial performance, liquidity and our ability to service or repay our existing indebtedness and to secure additional financing in the future. The Company bases its forward-looking statements on information available to it on the date of this release and undertakes no obligation to publicly update or revise any forward-looking statements, whether as a result of changed circumstances, new information, future events, or otherwise, except as may otherwise be required by law. Actual future events could also differ materially due to numerous factors that involve substantial known and unknown risks and uncertainties including, among other things, the risks and uncertainties set forth under “Risk Factors” and elsewhere in the Company’s reports on Form 10-K and Form 10-Q and the other risks and uncertainties discussed in any subsequent reports that the Company files with the Securities and Exchange Commission from time to time. Although we have attempted to identify those material factors that could cause actual results or events to differ from those described in such forward-looking statements, there may be other factors that could cause actual results or events to differ from those anticipated, estimated or intended. Given these uncertainties, investors are cautioned not to place undue reliance on our forward-looking statements.

Contacts

Investor Contact:
Eric Robinson

312-809-1093

ir@azekco.com

Media Contact:
Rachel Mihulka

402-980-9603

AZEKquestions@zenogroup.com

Dream Impact Trust Reports First Quarter Results

May 3, 2022 By Business Wire

This press release contains forward-looking information that is based upon assumptions and is subject to risks and uncertainties as indicated in the cautionary note contained within this press release. All dollar amounts in our tables are presented in thousands of Canadian dollars, except unit and per unit amounts, unless otherwise stated.

TORONTO–(BUSINESS WIRE)–DREAM IMPACT TRUST (TSX: MPCT.UN) (“Dream Impact”, “we”, “our” or the “Trust”) today reported its financial results for the three months ended March 31, 2022 (“first quarter”) .

In the first quarter, the National Capital Commission announced, in partnership with Canada Mortgage and Housing Corporation (“CMHC”), that the Trust and Dream Unlimited, the Trust’s asset manager (“Dream”), were the successful proponents to develop the first phase of the Building LeBreton project in Ottawa, Ontario. The site, which is adjacent to a light-rail station and in close proximity to the Trust’s 34-acre Zibi development, will be a 601-unit net zero rental project of which 40% will be affordable. Subsequent to March 31, 2022, the Trust closed on the land with construction expected to commence within the next two years.

Separately, in the first quarter, the Trust, Dream and Great Gulf Group were selected by Waterfront Toronto to develop the Quayside site in downtown Toronto. The 3.4 million square feet (“sf”) net zero carbon community will include over 800 affordable housing units, a two-acre forested green space and a significant urban farm. The site is adjacent to the Trust’s 5.3-acre Victory Silos site which received zoning approval for 1.3 million sf in 2021.

“We have entered 2022 with strong momentum as we were selected to develop both Quayside and LeBreton,” said Michael Cooper, Portfolio Manager. “Alongside Zibi, with these projects the Trust has access to develop and own it’s share in over $6 billion in net zero communities. We continue to make progress on tackling some of Canada’s largest societal issues, as we address climate change head on, continue to increase the affordable housing supply and partner with stakeholders across our communities to be innovative, all while creating further value for our unitholders. With nearly $300 million of income properties, at the Trust’s share, either built-out or acquired over the last year, we are demonstrating our ability to successfully execute on developments and asset acquisitions to support the Trust’s growth targets.”

On April 28, 2022, the Trust published its net zero roadmap, an important achievement as it outlines our path to be carbon neutral by 2035. As part of our ongoing commitments for transparency and accountability across our impact objectives, we anticipate releasing Dream’s annual impact report later in May 2022. For further details on the Trust’s net zero targets, refer to the following link.

Selected financial and operating metrics for the three months ended March 31, 2022, are summarized below:


Three months ended March 31,


2022


2021

Condensed consolidated results of operations


Net income (loss)

$

349

$

(6,212)

Net income (loss) per unit(1)


0.01


(0.10)


Distributions declared and paid per unit


0.10


0.10

Units outstanding – end of period


65,337,152


64,885,017

Units outstanding – weighted average


65,285,072


64,956,996

During the first quarter, the Trust reported net income of $0.3 million compared to a net loss of $6.2 million in the comparative period. The improvement in earnings was driven by the composition of fair value changes in each respective period, reduced G&A expense, partially offset by higher interest expense related to the Trust’s convertible debentures and a fluctuation in income tax recovery.

As at March 31, 2022, the Trust had $3.9 million of cash-on-hand. The Trust’s debt-to-asset value(1) as at March 31, 2022 was 20.4%, relatively consistent with the debt-to-asset value(1) as at December 31, 2021 of 19.2%. The Trust’s debt-to-total asset value, inclusive of project-level debt(1) and assets within our development segment, including equity accounted investments, was 54.5% as at March 31, 2022, compared to 52.6% as at December 31, 2021, primarily due to additional project-level financing. As at March 31, 2022, the Trust had access to a credit facility to borrow up to $50.0 million, from which the Trust had drawn $8.7 million.

Recurring Income

During the first quarter, the Trust’s recurring income segment generated net income of $6.2 million compared to a net loss of $0.2 million in the comparative period. The increase relative to the prior year was due to the timing of fair value gains and transaction costs incurred on commercial properties acquired in early 2021. Included in the Trust’s recurring income segment in the period were $4.5 million of fair value gains on the Trust’s multi-family rental portfolio, of which nearly 80% was supported by third-party appraisals driven by favourable market conditions.

In the three months ended March 31, 2022, the Trust closed on a first-of-its-kind loan with Canada Infrastructure Bank under its Commercial Building Retrofits Initiative (“CBRI”) to finance building retrofits across the Trust’s income properties and support our net-zero targets. The Trust anticipates the first decarbonization project within this initiative to be Sussex Centre, the Trust’s 655,000 sf co-owned commercial building with Dream Office Real Estate Investment Trust located in the GTA.

Subsequent to March 31, 2022, the Trust alongside Dream, announced $153 million in insured financing under CMHC’s new MLI Select insurance product through TD Bank. This financing will preserve and increase the number of affordable units at the Trust’s recently acquired Residence at Weston, in addition to decreasing energy consumption and greenhouse gas (“GHG”) emissions by at least 15% and 25%, respectively. Innovative financing solutions such as MLI Select and CBRI provide the Trust with the ability to efficiently meet our impact targets with more attractive financing compared to traditional debt, reduced equity, and further demonstrates our ability to work effectively with government stakeholders.

The Trust is actively pursuing further growth in this segment. Based on the Trust’s current development pipeline, we have an additional 2,218 residential units and 127,000 sf of commercial and retail (at 100%) that will be completed and contribute to recurring income over the next three years. For further details, refer to the “Three Year Recurring Income” table in Section 2.1, “Recurring Income” in the Trust’s MD&A for the three months ended March 31, 2022.

Development

In the first quarter, the development segment generated a net loss of $2.3 million, compared to a net loss of $4.7 million in the comparative period. The improvement relative to prior year was primarily attributable to a fair value loss on the Trust’s legacy investment in Empire Lakeshore in 2021, partially offset by the net impact of fair value adjustments on certain development blocks at Zibi in each period.

We continue to make steady progress on the Trust’s active projects under construction, as well as those in the pre-development and rezoning stage. With approximately one-third of the Trust’s portfolio being in the rezoning process, we expect to unlock additional value within the next two years as approvals are obtained. This includes 49 Ontario Street which is an 88,000 sf commercial property located in downtown Toronto, for which the Trust has resubmitted its zoning application. We are targeting approval for approximately 800,000 sf of density, inclusive of an adjacent land assembly currently in the Trust’s acquisition pipeline. As at March 31, 2022, the Trust carried 49 Ontario Street at $95.0 million.

Other(2)

In the first quarter, the Other segment generated a net loss of $3.5 million compared to $1.3 million in the prior year. The variance was primarily driven by interest expense on the Trust’s convertible debentures and fluctuations in our income tax recovery period over period. This was partially offset by the management fee expense and one-time consulting costs incurred in the prior period.

In June 2021, the Trust renewed its arrangement to satisfy the management fees payable to DAM in units of the Trust converted at the most recent year-end NAV per unit(1) as determined by the Trust and recorded for accounting purposes based on the trading price on the date of settlement, until the end of 2023. Accordingly, the management fee payable for the three months ended March 31, 2022, was recorded at a discount relative to the comparative period which was recorded gross.

Unit Buyback Activity

From the inception of the Trust’s unit buyback program in December 2014 to May 2, 2022, the Trust has repurchased 15.4 million units for cancellation, for a total cost of $96.0 million. In the first quarter, the Trust renewed its normal course issuer bid, allowing the Trust to repurchase up to a maximum of 4.6 million units.

As at May 2, 2022, the Trust’s asset manager, DAM, owns 18.9 million units of the Trust, inclusive of 1.3 million units acquired under the Trust’s distribution reinvestment plan, 3.9 million units acquired in satisfaction of the asset management fees and the remainder acquired on the open market for DAM’s own account. In aggregate, DAM owns approximately 29% of the Trust as at May 2, 2022.

Cash Generated from Operating Activities

Cash utilized in operating activities for the three months ended March 31, 2022 was $1.2 million compared to cash generated of $6.0 million in the prior year. The decrease in cash generated from operating activities was driven by timing of proceeds received from certain development and investment holdings, interest payments on the Trust’s convertible debentures and changes in non-cash working capital.

Trustee Appointed to the Board

On March 28, 2022, the Trust appointed Robert Goodall to the Board of Trustees. Mr. Goodall is the President and founder of Canadian Mortgage Capital Corporation, a company which operates various real estate debt and equity platforms and has a total of $1.8 billion of assets under management. Mr. Goodall is also President and CEO of Atrium Mortgage Investment Corporation, a $775 million non-bank lender which trades on the TSX.

Footnotes

(1) For the Trust’s definition of the following specified financial measures: debt-to-asset value, debt-to-total asset value, inclusive of project-level debt, net income (loss) per unit, please refer to the cautionary statements under the heading “Specified Financial Measures and Other Measures” in this press release and the Specified Financial Measures and Other Disclosures section of the Trust’s MD&A.


(2) Includes other Trust amounts not specifically related to the segments.


About Dream Impact

Dream Impact is an open-ended trust dedicated to impact investing. Dream Impact’s underlying portfolio is comprised of exceptional real estate assets reported under two operating segments: development and investment holdings, and recurring income, that would not be otherwise available in a public and fully transparent vehicle, managed by an experienced team with a successful track record in these areas. The objectives of Dream Impact are to create positive and lasting impacts for our stakeholders through our three impact verticals: environmental sustainability and resilience, attainable and affordable housing, and inclusive communities; while generating attractive returns for investors. For more information, please visit: www.dreamimpacttrust.ca.

Specified Financial Measures and Other Measures

The Trust’s condensed consolidated financial statements are prepared in accordance with International Financial Reporting Standards (“IFRS”). In this press release, as a complement to results provided in accordance with IFRS, the Trust discloses and discusses certain specified financial measures, including debt-to-asset value, debt-to-total asset value inclusive of project-level debt, NAV, NAV per unit and net income (loss) per unit, as well as other measures discussed elsewhere in this release. These specified financial measures are not defined by IFRS, do not have a standardized meaning and may not be comparable with similar measures presented by other issuers. The Trust has presented such specified financial measures as management believes they are relevant measures of our underlying operating performance and debt management. Specified financial measures should not be considered as alternatives to unitholders’ equity, net income, total comprehensive income or cash flows generated from operating activities, or comparable metrics determined in accordance with IFRS as indicators of the Trust’s performance, liquidity, cash flow and profitability. For a full description of these measures and, where applicable, a reconciliation to the most directly comparable measure calculated in accordance with IFRS, please refer to the Section 6, “Specified Financial Measures and Other Disclosures” section in the Trust’s MD&A for the three months ended March 31, 2022.

“Debt-to-asset value” represents the total debt payable for the Trust divided by the total asset value of the Trust as at the applicable reporting date. This non-GAAP ratio is an important measure in evaluating the amount of debt leverage; however, it is not defined by IFRS, does not have a standardized meaning, and may not be comparable with similar measures presented by other issuers.

As at

March 31,

2022

December 31,

2021

Total debt

$

142,110

$

133,150

Unamortized discount on host instrument of convertible debentures


765


809

Conversion feature


(564)


(357)

Unamortized balance of deferred financing costs


1,137


1,300

Total debt payable

$

143,448

$

134,902

Total assets


704,137


701,702

Debt-to-asset value


20.4%


19.2%

“Debt-to-total asset value, inclusive of project-level debt” represents the Trust’s total debt payable plus the debt payable within our development and investment holdings, and equity accounted investments, divided by the total asset value of the Trust plus the debt payable within our development and investment holdings, and equity accounted investments, as at the applicable reporting date. This specified financial measure is an important measure in evaluating the amount of debt leverage inclusive of project-level debt within our development and investment holdings, and equity accounted investments; however, it is not defined by IFRS, does not have a standardized meaning, and may not be comparable with similar measures presented by other issuers.


March 31,

2022

December 31,

2021

Debt payable within our development and investment holdings, and equity accounted investments

$

529,385

$

493,217

Total assets


704,137


701,702

Total assets, inclusive of project-level debt

$

1,233,522

$

1,194,919


Debt payable within our development and investment holdings, and equity accounted investments


529,385


493,217

Total debt payable


143,448


134,902

Total debt, inclusive of project-level debt

$

672,833

$

628,119


Debt-to-total asset value, inclusive of project-level debt and assets within our development segment, including equity accounted investments


54.5%


52.6%

“Net income (loss) per unit” represents net income (loss) of the Trust divided by the weighted average number of units outstanding during the period.


Three months ended March 31,


2022


2021

Net income (loss)

$

349

$

(6,212)

Units outstanding – weighted average


65,285,072


64,956,996

Net income (loss) per unit

$

0.01


(0.10)

Forward-Looking Information

This press release may contain forward-looking information within the meaning of applicable securities legislation. Forward-looking information generally can be identified by the use of forward-looking terminology such as “outlook”, “objective”, “may”, “will”, “would”, “could”, “expect”, “intend”, “estimate”, “anticipate”, “believe”, “should”, “plans”, or “continue”, or similar expressions suggesting future outcomes or events. Some of the specific forward-looking information in this press release may include, among other things, statements relating to the Trust’s objectives and strategies to achieve those objectives, our beliefs, plans, estimates, projections and intentions, and similar statements concerning anticipated future events, future growth and drivers thereof, results of operations, performance, business prospects and opportunities, market conditions, acquisitions or divestitures, leasing transactions, future maintenance and development plans and costs, capital investments, financing, the availability of financing sources, income taxes, litigation and the real estate and lending industries in general, in each case, that are not historical facts; as well as statements regarding: our development pipelines; the Trust’s focus on impact investing and expectations; the Trust’s ability to achieve its impact and sustainability goals, and implementing other sustainability initiatives throughout its projects; the Trust’s plans and proposals for current and future development projects, including their expected sustainability impact; expectations regarding Zibi’s rental affordability and the number of affordable housing units, green space and urban farm to be developed at the Quayside site; development timelines and rezoning applications, including commencement of construction of our development projects; expectations regarding the Trust’s access to developing and owning over $6 billion in net zero communities, partnering with stakeholders and creating value for unitholders; the intended use of proceeds of the insured financing obtained from TD Bank under the MLI Select insurance product for certain investments at Residence at Weston and of the loan obtained under Canada Infrastructure Bank’s Commercial Building Retrofits Initiative in respect of the decarbonization of Sussex Centre and other projects; the Trust’s expectation of adding 91,000 sf of commercial space at Zibi over the next twelve months; the approval of the Trust’s rezoning application resubmitted for 49 Ontario for 800,000 sf of density inclusive of closing on an adjacent land assembly; and the 2,218 residential units and 127,000 sf of commercial and retail (at 100%) which are expected to be completed and contribute to recurring income over the next three years. Forward-looking information is based on a number of assumptions and is subject to a number of risks and uncertainties, many of which are beyond the Trust’s control, which could cause actual results to differ materially from those that are disclosed in or implied by such forward-looking information. These risks and uncertainties include, but are not limited to: adverse changes in general economic and market conditions; the impact of the novel coronavirus (COVID-19 and variants thereof) pandemic on the Trust; risks associated with unexpected or ongoing geopolitical events, including disputes between nations, terrorism or other acts of violence, and international sanctions; the disruption of free movement of goods and services across jurisdictions; the risk of adverse global market, economic and political conditions and health crises; risks inherent in the real estate industry; risks relating to investment in development projects; impact investing strategy risk; risks relating to geographic concentration; risks inherent in investments in real estate, mortgages and other loans and development and investment holdings; credit risk and counterparty risk; competition risks; environmental and climate change risks; risks relating to access to capital; interest rate risk; the risk of changes in governmental laws and regulations; tax risks; foreign exchange risk; acquisitions risk; and leasing risks. Our objectives and forward-looking statements are based on certain assumptions with respect to each of our markets, including that the general economy remains stable; the gradual recovery and growth of the general economy continues over 2022; that no unforeseen changes in the legislative and operating framework for our business will occur; that there will be no material change to environmental regulations that may adversely impact our business; that we will meet our future objectives, priorities and growth targets; that we receive the licenses, permits or approvals necessary in connection with our projects; that we will have access to adequate capital to fund our future projects, plans and any potential acquisitions; that we are able to identify high quality investment opportunities and find suitable partners with which to enter into joint ventures or partnerships; that we do not incur any material environmental liabilities; interest rates remain stable; there will not be a material change in foreign exchange rates; that the impact of the current economic climate and global financial conditions on our operations will remain consistent with our current expectations; our expectations regarding the impact of the COVID-19 pandemic and government measures to contain it; our expectation regarding ongoing remote working arrangements; and competition for and availability of acquisitions remains consistent with the current climate. All forward-looking information in this press release speaks as of May 2, 2022. The Trust does not undertake to update any such forward-looking information whether as a result of new information, future events or otherwise, except as required by law. Additional information about these assumptions and risks and uncertainties is disclosed in the Trust’s filings with securities regulators filed on the System for Electronic Document Analysis and Retrieval (www.sedar.com), including its latest annual information form and MD&A. These filings are also available at the Trust’s website at www.dreamimpacttrust.ca.

Contacts

For further information, please contact:

Meaghan Peloso
Chief Financial Officer

416 365-6322

mpeloso@dream.ca

Kimberly Lefever
Director, Investor Relations

416 365-6339

klefever@dream.ca

Daikin Completes Acquisition of CCOM Group, Inc. for Distribution in New Jersey and Surrounding States

May 3, 2022 By Business Wire

WALLER, Texas & HAWTHORNE, N.J.–(BUSINESS WIRE)–#HVAC–Daikin Comfort Technologies North America, Inc. (Daikin) closed on the acquisition of CCOM Group, Inc. (OTC Pink: “CCOM”, “CCOMP”) and its wholly owned subsidiaries for $2.71 per share of common stock and convertible preferred stock today.

Earlier in the year Daikin announced a unified strategy to leverage strengths from Goodman and Daikin brands to expand business under one unified vision and to promote environmental solutions in the North American market. In its strategic management plan, FUSION 25, Daikin has set its sights on becoming the top provider of HVAC solutions in North America. This acquisition will contribute to the success of both strategies in the Northeast.

CCOM’s subsidiaries, Universal Supply Group, Inc., RAL Supply Group, Inc., and S&A Supply, Inc., have shaped it into a leading, full line distributor of HVAC products, building management systems, plumbing and electrical supplies, and parts and accessories in the Northeastern United States.

CCOM will continue to supply and promote the full line of residential unitary Goodman and Amana® brand equipment, Daikin ductless and light commercial HVAC products as well as a diverse lineup of additional brands and products. This includes building management systems and controls, other HVAC, indoor air quality, hydronic, plumbing and electrical equipment and supplies throughout its 15 locations across New Jersey, New York and Massachusetts.

CCOM and its subsidiaries will operate as a wholly owned business unit of Daikin, while maintaining their headquarters in Hawthorne, New Jersey with more than 165 employees.

About Daikin

Daikin Industries, Ltd. (DIL) is a Fortune 1,000 company with more than 84,870 employees worldwide and is the world’s #1 indoor comfort solutions provider company. Daikin Comfort Technologies North America, Inc. (DNA) is a subsidiary of DIL, providing Daikin, Goodman, Amana® and Quietflex brands products. DNA and its affiliates manufacture heating and cooling systems for residential, commercial and industrial use and are sold via independent HVAC contractors. DNA engineering and manufacturing is located at Daikin Texas Technology Park near Houston, Texas. For additional information, visit www.northamerica-daikin.com. Amana® is a registered trademark of Maytag Corporation or its related companies and is used under license. All rights reserved.

About CCOM Group

CCOM Group, Inc., based in Hawthorne, New Jersey with 15 total locations, has been an industry leader in HVAC, climate control systems, plumbing and electrical supplies for more than 100 years. Through its subsidiaries and divisions, Universal Supply Group, RAL Supply Group, Inc., S&A Supply, Inc., and the Universal Energy Products Division, CCOM distributes equipment, parts, and accessories throughout the Northeast. The company’s reach extends from Albany, New York and Western Massachusetts (S&A Supply) down through the Hudson Valley, Westchester County, and Long Island (RAL Supply) and through all of New Jersey (Universal Supply Group). For additional information, visit https://ccom-group.com/.

This release includes forward-looking statements, including those regarding the benefits of the transactions, the combined company’s plans and prospects, and other statements that are not historical facts. The forward-looking statements involve a number of risks, uncertainties and other factors that could cause actual results to differ materially from those contained in the forward-looking statements, some of which are beyond our control. Forward-looking statements speak only as of the date of this release and we disclaim any duty to update them except as required by law.

Contacts

Marc Bellanger

713.263.5505

marc.bellanger@daikincomfort.com

Wendy Hall

713.232.9229

wendy.hall@daikincomfort.com

Angie Meyer

201.249.4874

ameyer@usginc.com

SWTCH Raises $13 Million to Provide Equitable Access to Electric Vehicle Charging Infrastructure in Communities Across North America

April 28, 2022 By Business Wire

SWTCH is poised to improve electric vehicle charging accessibility with low-cost solutions tailored to multi-family buildings at all income levels

TORONTO–(BUSINESS WIRE)–SWTCH Energy Inc. has closed $13 million USD in new financing to expand its electric vehicle (EV) charging solutions to multi-family buildings across North America, with an emphasis on serving the transition to electrified transportation for market-rate and low-to-moderate income (LMI) communities. The new capital includes a $10 million USD Series A round led by the venture capital arm of Aligned Climate Capital and a $3 million USD credit facility from Silicon Valley Bank. Additional Series A investors include Landmark Management Inc., Elemental Energy, IBI Group, Active Impact Investments, and Pacific Reach.

SWTCH provides EV charging and energy management solutions that address the unique challenges of EV ownership in multi-family buildings of all kinds. SWTCH’s unique approach to EV charging and energy management lowers the financial and technological barriers to EV ownership by employing cost-effective, software-based energy management solutions to multi-family buildings where electrical infrastructure hardware upgrades can be prohibitively expensive. Additionally, SWTCH’s charging-as-a-service model reduces the financial barriers to providing equitable access to EV charging infrastructure, which eliminates the upfront costs and reduces the operational costs of EV charging management by incorporating clean fuel standard credits, charging infrastructure incentives, and ancillary service market participation as part of the core offering.

“SWTCH’s mission is centered on realizing the social, economic, and environmental benefits of widespread EV adoption,” said Carter Li, CEO of SWTCH. “We know that more than 80% of EV charging occurs at home and 30% of homes in North America are multi-family, so improving access to EV charging infrastructure in multi-family buildings is critical to enabling widespread EV adoption. With over 75% of our charging stations currently deployed in multi-family buildings, SWTCH strongly believes in the importance of providing equitable, convenient, and affordable charging access at home, where people need it the most. This round of new financing will help us accelerate our growth into these locations by expanding our ability to fund more charging-as-a-service projects in low- and moderate-income communities across North America.”

“With rising gas prices, more and more Americans are looking to purchase electric vehicles. But that means we need more charging infrastructure and we need it where people live,” said Peter Davidson, CEO of Aligned Climate Capital. “We are proud to invest in a company that makes it easier for people to go electric, save money, and be a part of the climate solution.”

“SVB is excited to support SWTCH as they scale EV charger deployments in the critical multi-family building segment,” said Graeme Millen, Managing Director at SVB Canada. “Providing creative capital to enable SWTCH’s Charging-as-a-Service model is aligned with our commitment to the Climate Tech and Sustainability sector and helping accelerate the impact of companies and founders developing and scaling game-changing technology.”

SWTCH charging systems are currently installed in 200 multi-family buildings, 50% of which are classified as low-to-moderate income. As a current cohort of the Clean Fight Program, a not-for-profit climate-tech accelerator supported by the New York State Energy Research and Development Authority (NYSERDA) and New Energy Nexus, SWTCH is collaborating with other clean building technology providers to decarbonize and electrify the mass of New York’s non-luxury residential and commercial buildings, in order to generate equitable climate impacts while providing health, comfort, and savings benefits to LMI communities most impacted by the climate crisis. Under the new $2.5 billion Discretionary Grant Program for Charging and Fueling Infrastructure established by President Biden’s $7.5 billion Bipartisan Infrastructure Law, at least 50 percent of this funding will be used for a community grant program where priority is given to projects that expand access to EV charging and alternative fueling infrastructure within LMI communities.

“SWTCH was selected as one of just a handful of cohort companies from a very competitive applicant pool to participate in the Clean Fight program that’s focused on high impact solutions that bring the environmental, economic and health benefits of deep decarbonization to non-luxury buildings. After less than six months in the program, SWTCH is already working on new installations in LMI communities in NY with two different partners in The Clean Fight, in collaboration with two other participating cohort companies,” said Thatcher Bell, Program Director at The Clean Fight.

By the end of 2022, SWTCH expects to manage 5,000 charging ports in over 900 locations in all 50 U.S. states and 10 Canadian provinces, of which over 50% will be in low-to-moderate income multi-family buildings.

About SWTCH Energy Inc.

SWTCH is headquartered in Toronto, Ontario with offices in Brooklyn, New York and Boston, Massachusetts. The company electric vehicle (EV) charging and energy management solutions streamline charging for drivers while optimizing usage and revenue for multi-family building operators. SWTCH is a proud member of Open Charge Alliance (OCA), OpenADR Alliance, and CharIN, basing its EV charging platform on open communication standards to ensure interoperable, scalable, and future-proof charging solutions to its clients.

About Aligned Climate Capital

Aligned Climate Capital LLC is an asset manager investing exclusively in the people, companies, and real assets that are decarbonizing the global economy. Founded in 2019, Aligned is a dynamic and mission-driven firm that believes solving climate change is a unique opportunity to generate strong financial returns, while also achieving meaningful environmental and social impact. The team works at the intersection of finance, technology, and public policy with a particular focus on ESG metrics. For more information, please visit www.AlignedClimateCapital.com.

About Silicon Valley Bank

Silicon Valley Bank (SVB) helps innovative companies and their investors move bold ideas forward, fast. SVB provides a full range of financial services and expertise to companies of all sizes in innovation centers around the world. SVB is recognized as one of the world’s best employers by Forbes, and is a member of the Bloomberg Gender Equality Index. In 2022, SVB committed to provide at least $5 billion by 2027 in loans, investments and other financing to support sustainability efforts and the company has set a goal to achieve carbon neutral operations by 2025. SVB’s sustainable finance commitment aims to support companies that are working to decarbonize the energy and infrastructure industries and hasten the transition to a sustainable, net zero emissions economy. Learn more at svb.com/Canada.

About The Clean Fight – New Energy Nexus

The Clean Fight is a not-for-profit clean energy accelerator designed to attract growth-stage startups to scale business in New York State. Supported by The New York State Energy Research and Development Authority (NYSERDA) and New Energy Nexus, this accelerator is open to companies from across the United States and around the world who are aggressively advancing ways to meet carbon reduction mandates, while boosting economic opportunity and job creation for all. www.thecleanfight.com.

Contacts

SWTCH Energy Inc.

info@swtchenergy.com
1-844-798-2438

Isaac Steinmetz

Antenna Group for SWTCH Energy

swtch@antennagroup.com

H.I.G. Realty Credit Partners Originates $102.5 Million Loan Secured by a 4,000-Unit Self-Storage Portfolio

April 28, 2022 By Business Wire

NEW YORK–(BUSINESS WIRE)–#AssetClass–H.I.G. Capital (“H.I.G.”), a leading global alternative investment firm with over $48 billion of equity capital under management, is pleased to announce that its affiliate, H.I.G. Realty Credit Partners, has originated a loan for the acquisition of a 5-property, 4,000-unit self-storage portfolio located across three states in New England.

The loan was made to an affiliate of Prime Group Holdings, LLC, a self-storage owner and operator. The properties are newly-built, best-in-class assets that are well-located within their respective markets.

“We are excited to finance an asset class with such strong fundamentals. Given Prime’s excellent track record, we look forward to their continued success in these markets,” said Michael Mestel, Managing Director at H.I.G. Realty Credit Partners.

About H.I.G. Realty Partners

H.I.G. Realty Partners is the real estate platform of H.I.G. Capital, a leading global alternative assets investment firm with over $48 billion of equity capital under management. H.I.G. Realty Partners manages $8.2 billion of assets and focuses on small-to-mid cap real estate, targeting both equity and debt investments across all property types located throughout the U.S., Europe, and Latin America. Debt investments include senior bridge loans, mezzanine loans and preferred equity collateralized by transitional properties and portfolios. Equity investments are concentrated on the acquisition of value-add assets, employing a hands-on, operationally focused approach that seeks to generate substantial cash flow and asset appreciation through rehabilitating, redeveloping, repositioning and rebranding assets that have been capital starved and/or poorly managed. For more information, please refer to the H.I.G. website www.higcapital.com.

About H.I.G. Capital

H.I.G. is a leading global alternative assets investment firm with over $48 billion of equity capital under management.* Based in Miami, and with offices in New York, Boston, Chicago, Dallas, Los Angeles, San Francisco, and Atlanta in the U.S., as well as international affiliate offices in London, Hamburg, Madrid, Milan, Paris, Bogotá, Rio de Janeiro and São Paulo, H.I.G. specializes in providing both debt and equity capital to small and mid-sized companies, utilizing a flexible and operationally focused/ value-added approach:

  1. H.I.G.’s equity funds invest in management buyouts, recapitalizations and corporate carve-outs of both profitable as well as underperforming manufacturing and service businesses.
  2. H.I.G.’s debt funds invest in senior, unitranche and junior debt financing to companies across the size spectrum, both on a primary (direct origination) basis, as well as in the secondary markets. H.I.G. is also a leading CLO manager, through its WhiteHorse family of vehicles, and manages a publicly traded BDC, WhiteHorse Finance.
  3. H.I.G.’s real estate funds invest in value-added properties, which can benefit from improved asset management practices.
  4. H.I.G. Infrastructure focuses on making value-add and core plus investments in the infrastructure sector.

Since its founding in 1993, H.I.G. has invested in and managed more than 300 companies worldwide. The firm’s current portfolio includes more than 100 companies with combined sales in excess of $30 billion. For more information, please refer to the H.I.G. website at www.higcapital.com.

* Based on total capital commitments managed by H.I.G. Capital and affiliates.

Contacts

Michael Mestel

Managing Director

mmestel@higrealty.com

Steven Schwartz

Managing Director

sschwartz@higcapital.com

Strategic Storage Trust VI, Inc. Acquires Two Recently-Constructed Properties in Greater Philadelphia Area

April 27, 2022 By Business Wire

LADERA RANCH, Calif.–(BUSINESS WIRE)–Strategic Storage Trust VI, Inc. (“SST VI”), a publicly-registered real estate investment trust sponsored by an affiliate of SmartStop Self Storage REIT, Inc. (“SmartStop”), announced today the acquisition of two recently-constructed self storage facilities in the Greater Philadelphia MSA. These represent the 11th and 12th acquisitions in SST VI. Since SST VI launched as a private REIT in the first quarter of 2021, the REIT has purchased approximately $165 million of self storage facilities and land parcels to be developed into self storage.

“We are excited to add these two newly-constructed properties to the SST VI portfolio, and simultaneously enter the Philadelphia market,” said Wayne Johnson, Chief Investment Officer of SST VI. “With our tenth acquisition in program, we believe we are amassing a very high quality portfolio that we expect will create strong value for stockholders.”

Located at 401 Bellevue Road, the newly constructed facility in Newark, DE, a suburb of Philadelphia, is a state-of-the-art facility that is well positioned to serve the areas of Wilson, Brookside, Ogletown, and The University of Delaware. Opened in August 2021, the four-story facility is comprised of approximately 80,650 square feet of rental space. The facility’s 830 units are 100% climate controlled with a blend of first-floor and elevator access units. Further, it is the only storage facility offering climate-controlled units within a 2-mile radius.

The Levittown, PA facility, which opened in October 2021, is located at 1723 Woodbourne Road in the Levittown, PA, the largest suburb of Philadelphia. The three-story facility offers approximately 78,000 square feet of rental space and 810 units, 100% of which is interior climate controlled. This location serves the areas of Fairless Hills, Langhorne, Woodbourne and Fallsington. The new SmartStop® Self Storage location has desirable amenities including a sophisticated security system, secured and alarmed doors, gated entry and interior climate-controlled units with spacious elevators for second and third level units.

About Strategic Storage Trust VI, Inc. (SST VI):

SST VI is a Maryland corporation that intends to qualify as a REIT for federal income tax purposes. SST VI’s primary investment strategy is to invest in income-producing and growth self storage facilities and related self storage real estate investments in the Unites States and Canada. As of April 26, 2022, SST VI has a portfolio of ten operating properties in the United States comprising approximately 6,830 units and 701,850 rentable square feet and joint venture interests in two development properties in Toronto, Ontario.

About SmartStop Self Storage REIT, Inc. (SmartStop):

SmartStop is a self-managed REIT with a fully integrated operations team of approximately 420 self storage professionals focused on growing the SmartStop® Self Storage brand. SmartStop, through its indirect subsidiary SmartStop REIT Advisors, LLC, also sponsors other self storage programs. As of April 26, 2022, SmartStop has an owned and managed portfolio of 167 properties in 22 states and Ontario, Canada, and comprising approximately 113,800 units and 12.9 million rentable square feet. SmartStop and its affiliates own or manage 19 operating self storage properties in the Greater Toronto Area, which total approximately 16,200 units and 1.7 million rentable square feet. Additional information regarding SmartStop is available at www.smartstopselfstorage.com.

Contacts

David Corak
VP of Corporate Finance

SmartStop Self Storage REIT, Inc.

949-429-3331

IR@smartstop.com

Advanced Clean Energy Storage Project Receives $500 Million Conditional Commitment from U.S. Department of Energy

April 27, 2022 By Business Wire

CONDITIONAL COMMITMENT FROM THE DOE’S LOAN PROGRAMS OFFICE IS THE LATEST MILESTONE IN THE DEVELOPMENT OF THE WORLD’S LARGEST GREEN HYDROGEN HUB, WHICH HAS ALSO SECURED ALL OTHER MAJOR CONTRACTS.

SALT LAKE CITY, Utah–(BUSINESS WIRE)–#ChangeInPower–The U.S. Department of Energy’s (DOE) Loan Programs Office announced today that it has issued a conditional commitment to Advanced Clean Energy Storage I, LLC, and Mitsubishi Power Americas, Inc. and Magnum Development, LLC, and Haddington Ventures, LLC, for up to $504.4MM in debt financing for the Advanced Clean Energy Storage Project, expected to be the world’s largest industrial green hydrogen production and storage facility (the “Project”). This conditional funding commitment signifies the latest development milestone for the Project.


The industry-leading Advanced Clean Energy Storage hydrogen hub, located in Delta, Utah, was announced in May 2019, and within three years is in the final stages of debt and equity closing. Currently, the hub has secured all major contracts including offtake; engineer, procure and construct (EPC) contractors; major equipment suppliers, and Operations and Maintenance (O&M) providers. Haddington Ventures, the financial advisor for the hub and equity sponsor of Magnum Development, is securing $650MM through its Equity Syndication Program. These critical financial investments will ensure the future growth and scalability of the hub.

“We are unbelievably excited to reach this important milestone, not just for our hub, but for the hydrogen industry as a whole,” said Michael Ducker, Senior Vice President of Hydrogen Infrastructure for Mitsubishi Power Americas and President of Advanced Clean Energy Storage I. “Equally rewarding is having spent the past year partnering and working with such a forward-thinking and incredibly talented team from the Intermountain Power Agency to trail blaze this market leading facility. We are honored to be sharing this industry moment with them along with all of our world-class partners joining this effort.”

The hub will initially be designed to convert renewable energy through 220 MW of electrolyzers to produce up to 100 metric tonnes per day of green hydrogen, which will then be stored in two massive salt caverns each capable of storing 150 GWh of energy. Financed with support from the DOE loan guarantee, this facility will supply hydrogen feedstock to the Intermountain Power Agency’s (IPA) IPP Renewed Project — an 840 MW hydrogen capable gas turbine combined cycle power plant — that will initially run on a blend of 30 percent green hydrogen and 70 percent natural gas by volume starting in 2025 and will increase to 100 percent by 2045.

“The IPP Renewed Project is committed to helping the region meet its carbon targets by utilizing green hydrogen as a tool to integrate affordably and reliably with the significant build-out of renewables. The scale, experience, and collaboration offered by the Advanced Clean Energy Storage hydrogen hub made their team the ideal partner for us to work with as we realize our vision towards 100% green hydrogen at the site,” said Greg Huynh, Operating Agent, IPA.

Multiple industry-leading entities are also involved in the hub, which broke ground this Spring, including:

  • Black & Veatch, an industry leader in engineering, procurement, and construction which will provide EPC services for the energy conversion facility and will draw on its extensive experience building complex energy infrastructure projects to construct the hydrogen production facilities.
  • Mitsubishi Power, an industry leader in technology offerings, will provide the hydrogen equipment integration including the 220 MW of electrolyzers, gas separators, rectifiers, medium voltage transformers, and distributed control system.
  • NAES Corporation, one of the energy industry’s largest independent providers of operations, maintenance, and repair services, will initially provide the O&M services for the plant and will oversee the current projected team of 20 plant-related personnel.
  • Utah School and Institutional Trust Lands Administration, a subdivision of the State of Utah, leases the site and utilizes revenue generated from the hydrogen hub to benefit Utah schools.
  • WSP, a global leader in engineering that develops creative, comprehensive and sustainable solutions to help communities thrive, will provide EPC Management services for the development of two large salt cavern storage facilities. WSP has been developing underground storage facilities since the 80s and has developed over 200 salt caverns for top tier midstream companies.

“The Advanced Clean Energy Storage Project is well on its way to achieving its goal in the creation of a world-class green hydrogen hub,” said Craig Broussard, CEO of the joint venture. “Through our network of partners, we have the potential to provide low-cost green hydrogen to verticals in addition to power, including refineries, heavy industrials, and the transportation sector.”

While this conditional commitment demonstrates the Department’s intent to finance the project, several steps remain, and certain conditions must be satisfied before DOE issues a loan guarantee.

The hub is actively seeking partners to bring green jobs and green hydrogen to support rural Utah and greater decarbonization across industries. For more information, visit www.aces-delta.com.

About Mitsubishi Power Americas, Inc.

Mitsubishi Power Americas, Inc. (Mitsubishi Power) headquartered in Lake Mary, Florida, employs more than 2,300 power generation, energy storage, and digital solutions experts and professionals. Our employees are focused on empowering customers to affordably and reliably combat climate change while also advancing human prosperity throughout North, Central, and South America. Mitsubishi Power’s power generation solutions include gas, steam, and aero-derivative turbines; power trains and power islands; geothermal systems; PV solar project development; environmental controls; and services. Energy storage solutions include green hydrogen, battery energy storage systems, and services. Mitsubishi Power also offers intelligent solutions that use artificial intelligence to enable autonomous operation of power plants. Mitsubishi Power is a power solutions brand of Mitsubishi Heavy Industries, Ltd. (MHI). Headquartered in Tokyo, Japan, MHI is one of the world’s leading heavy machinery manufacturers with engineering and manufacturing businesses spanning energy, infrastructure, transport, aerospace, and defense. For more information, visit the Mitsubishi Power Americas website and follow us on LinkedIn.

About Magnum Development

Magnum Development, LLC is developing the only known “Gulf Coast” style domal-quality salt formation in the western United States. Magnum was founded in 2008 to create an energy hub centered around a large, little known salt body near Delta, Utah. Site viability and profitability has been proven with one business, Magnum NGLs, LLC, which was successfully developed, brought to commercialization, and sold in 2015. In March 2018, Magnum Development entered into a joint venture with Sawtooth by contributing its refined products business for an 8% ownership interest in the Sawtooth JV. A second JV was formed with Mitsubishi Power Systems in 2019 to add the storage and conversion of fossil free energy to the energy hub’s portfolio of products. As the Delta, Utah energy hub grows, Magnum will pursue additional strategic partners to broaden the strengths and products of the enterprise.

About Haddington Ventures

Founded in 1998, Haddington Ventures, LLC oversees a growing portfolio of successful conventional and renewable energy businesses that are bringing innovative new infrastructure to the U.S. energy sector. Haddington Ventures, through its private equity funds, generally makes control-oriented investments in portfolio companies acquiring or developing energy infrastructure underwritten by long term contracts. Haddington Ventures is led by a team of senior energy professionals who have invested more than $1.5 billion in companies focused on energy infrastructure across multiple private equity funds and co-investment partnerships.

About ACES Delta

ACES Delta is a joint venture between Mitsubishi Power Americas and Magnum Development. ACES Delta is developing the world’s largest renewable energy hub to produce, store, and deliver green hydrogen to the Western United States. Located in Delta, Utah, the Advanced Clean Energy Storage hub will serve as the country’s largest hydrogen gas and storage hub, initially providing over 300GWh of clean energy annually to the region. For more information, visit www.aces-delta.com.

Contacts

Communications Contacts
Mitsubishi Power Americas

Christa Reichhardt

+1 407-484-5599

Christa.Reichhardt@amermhi.com

Magnum Development

Michelle Judd

+1 801-748-5561

mjudd@magnumdev.com

Haddington Ventures

Sam Pyne

+1 713-532-7992

spyne@hvllc.com

  • « Previous Page
  • 1
  • …
  • 85
  • 86
  • 87
  • 88
  • 89
  • …
  • 105
  • Next Page »

Sign up for the Daily Digest Email!

Receive the latest news stories from the REIT Report every morning for FREE!

100% Privacy. No SPAM. We promise.

Daily Movers

Ticker News Price Chg Chg%
d.un:ca$14.92.7118.16%
csh.un:ca$9.340.545.78%
ax.un:ca$6.920.223.13%
kmp.un:ca$17.730.623.5%
nwh.un:ca$8.020.222.69%
mrt.un:ca$5.24-0.01-0.19%
grt.un:ca$81.72-0.11-0.13%
hot.un:ca$2.53-0.01-0.39%
fcr.un:ca$15.35-0.05-0.32%
dir.un:ca$14.22-0.41-2.87%
 

Market Snapshot

  • Advertise
  • About
  • Contact
  • Privacy Policy

Copyright © 2025 · REIT REPORT