NOT FOR DISTRIBUTION TO UNITED STATES NEWSWIRE SERVICES OR FOR DISSEMINATION IN THE UNITED STATES
OTTAWA, Ontario–(BUSINESS WIRE)–InterRent Real Estate Investment Trust (“InterRent”, the “REIT”) (TSX: IIP.UN) is thrilled to announce today that it has closed on the purchase of a 605-suite apartment community at 2 & 4 Hanover Road in Brampton, Ontario.
![]()
The acquisition is a joint-venture with Crestpoint Real Estate Investments Limited and Vestcor Inc. InterRent‘s initial equity interest in the joint-venture is 10%. The REIT retains optionality to increase its ownership to one third within the first two years after closing. InterRent will also act as property manager on behalf of the joint-venture.
The total purchase price of $185.5 million will be funded through cash and an assumption of a $100 million existing mortgage with a major institutional lender. This highly attractive, long-term financing features interest-only payments at 2.17% and a term to maturity of approximately six years.
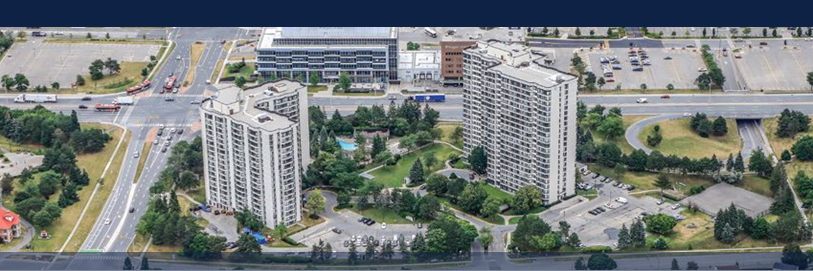
The community is comprised of two concrete high-rise towers at 18 and 22 storeys each, with 281 and 324 suites respectively. The community was constructed circa 1984 and is fully air conditioned through a central cooling system. Suites feature spacious designs averaging well over 900 square feet, with two thirds of the suites being 2-Bedroom units. The community also features a full range of amenities including outdoor pool, barbeque area, playground, gym, car wash, and multi-purpose rooms.
The purchase adds to an expanding portfolio in the Greater Toronto Area for InterRent. At over 600 suites and complete with a wide variety of amenities, the community provides an excellent opportunity for the REIT to bring it’s best-in-class operating platform to a rapidly growing suburban area.
“We are extremely excited to expand our footprint within the GTA” said InterRent President & CEO Brad Cutsey. “Not only are we looking forward to offering our unique resident experience and to help contribute to the Brampton community, but this acquisition also puts us in a great position to contribute to potential new supply in a constrained market.”
Beyond the existing high-rises, the acquisition also offers immediate opportunity to deliver additional and much-needed rental supply to the GTA. The community is located on approximately 10-acres of land and with zoning approvals in place for over 350,000 square feet of additional density. This will be much needed for the City of Brampton in particular as it is one of the Greater Toronto Area’s burgeoning suburbs, having grown 10.6% from 2016 to 2021, outpacing provincial growth of 5.8% for the same period. Brampton is well positioned to continue this growth trajectory as it attracts a disproportionate share of Canada’s ambitious immigration targets.
2 & 4 Hanover Road is well located within Brampton off Queen Street and is adjacent to Bramalea City Centre, a regional shopping centre with over 1.5 million square feet of commercial space. The community is also directly west of Chinguacousy Park, a 100-acre natural outdoor amenity.
About InterRent
InterRent REIT is a growth-oriented real estate investment trust engaged in increasing Unitholder value and creating a growing and sustainable distribution through the acquisition and ownership of multi-residential properties.
InterRent’s strategy is to expand its portfolio primarily within markets that have exhibited stable market vacancies, sufficient suites available to attain the critical mass necessary to implement an efficient portfolio management structure and, offer opportunities for accretive acquisitions.
InterRent’s primary objectives are to use the proven industry experience of the Trustees, Management and Operational Team to: (i) to grow both funds from operations per Unit and net asset value per Unit through investments in a diversified portfolio of multi-residential properties; (ii) to provide Unitholders with sustainable and growing cash distributions, payable monthly; and (iii) to maintain a conservative payout ratio and balance sheet.
The Toronto Stock Exchange has not reviewed and does not accept responsibility for the adequacy or accuracy of this release.
Contacts
Investor Relations
investorinfo@interrentreit.com
www.interrentreit.com