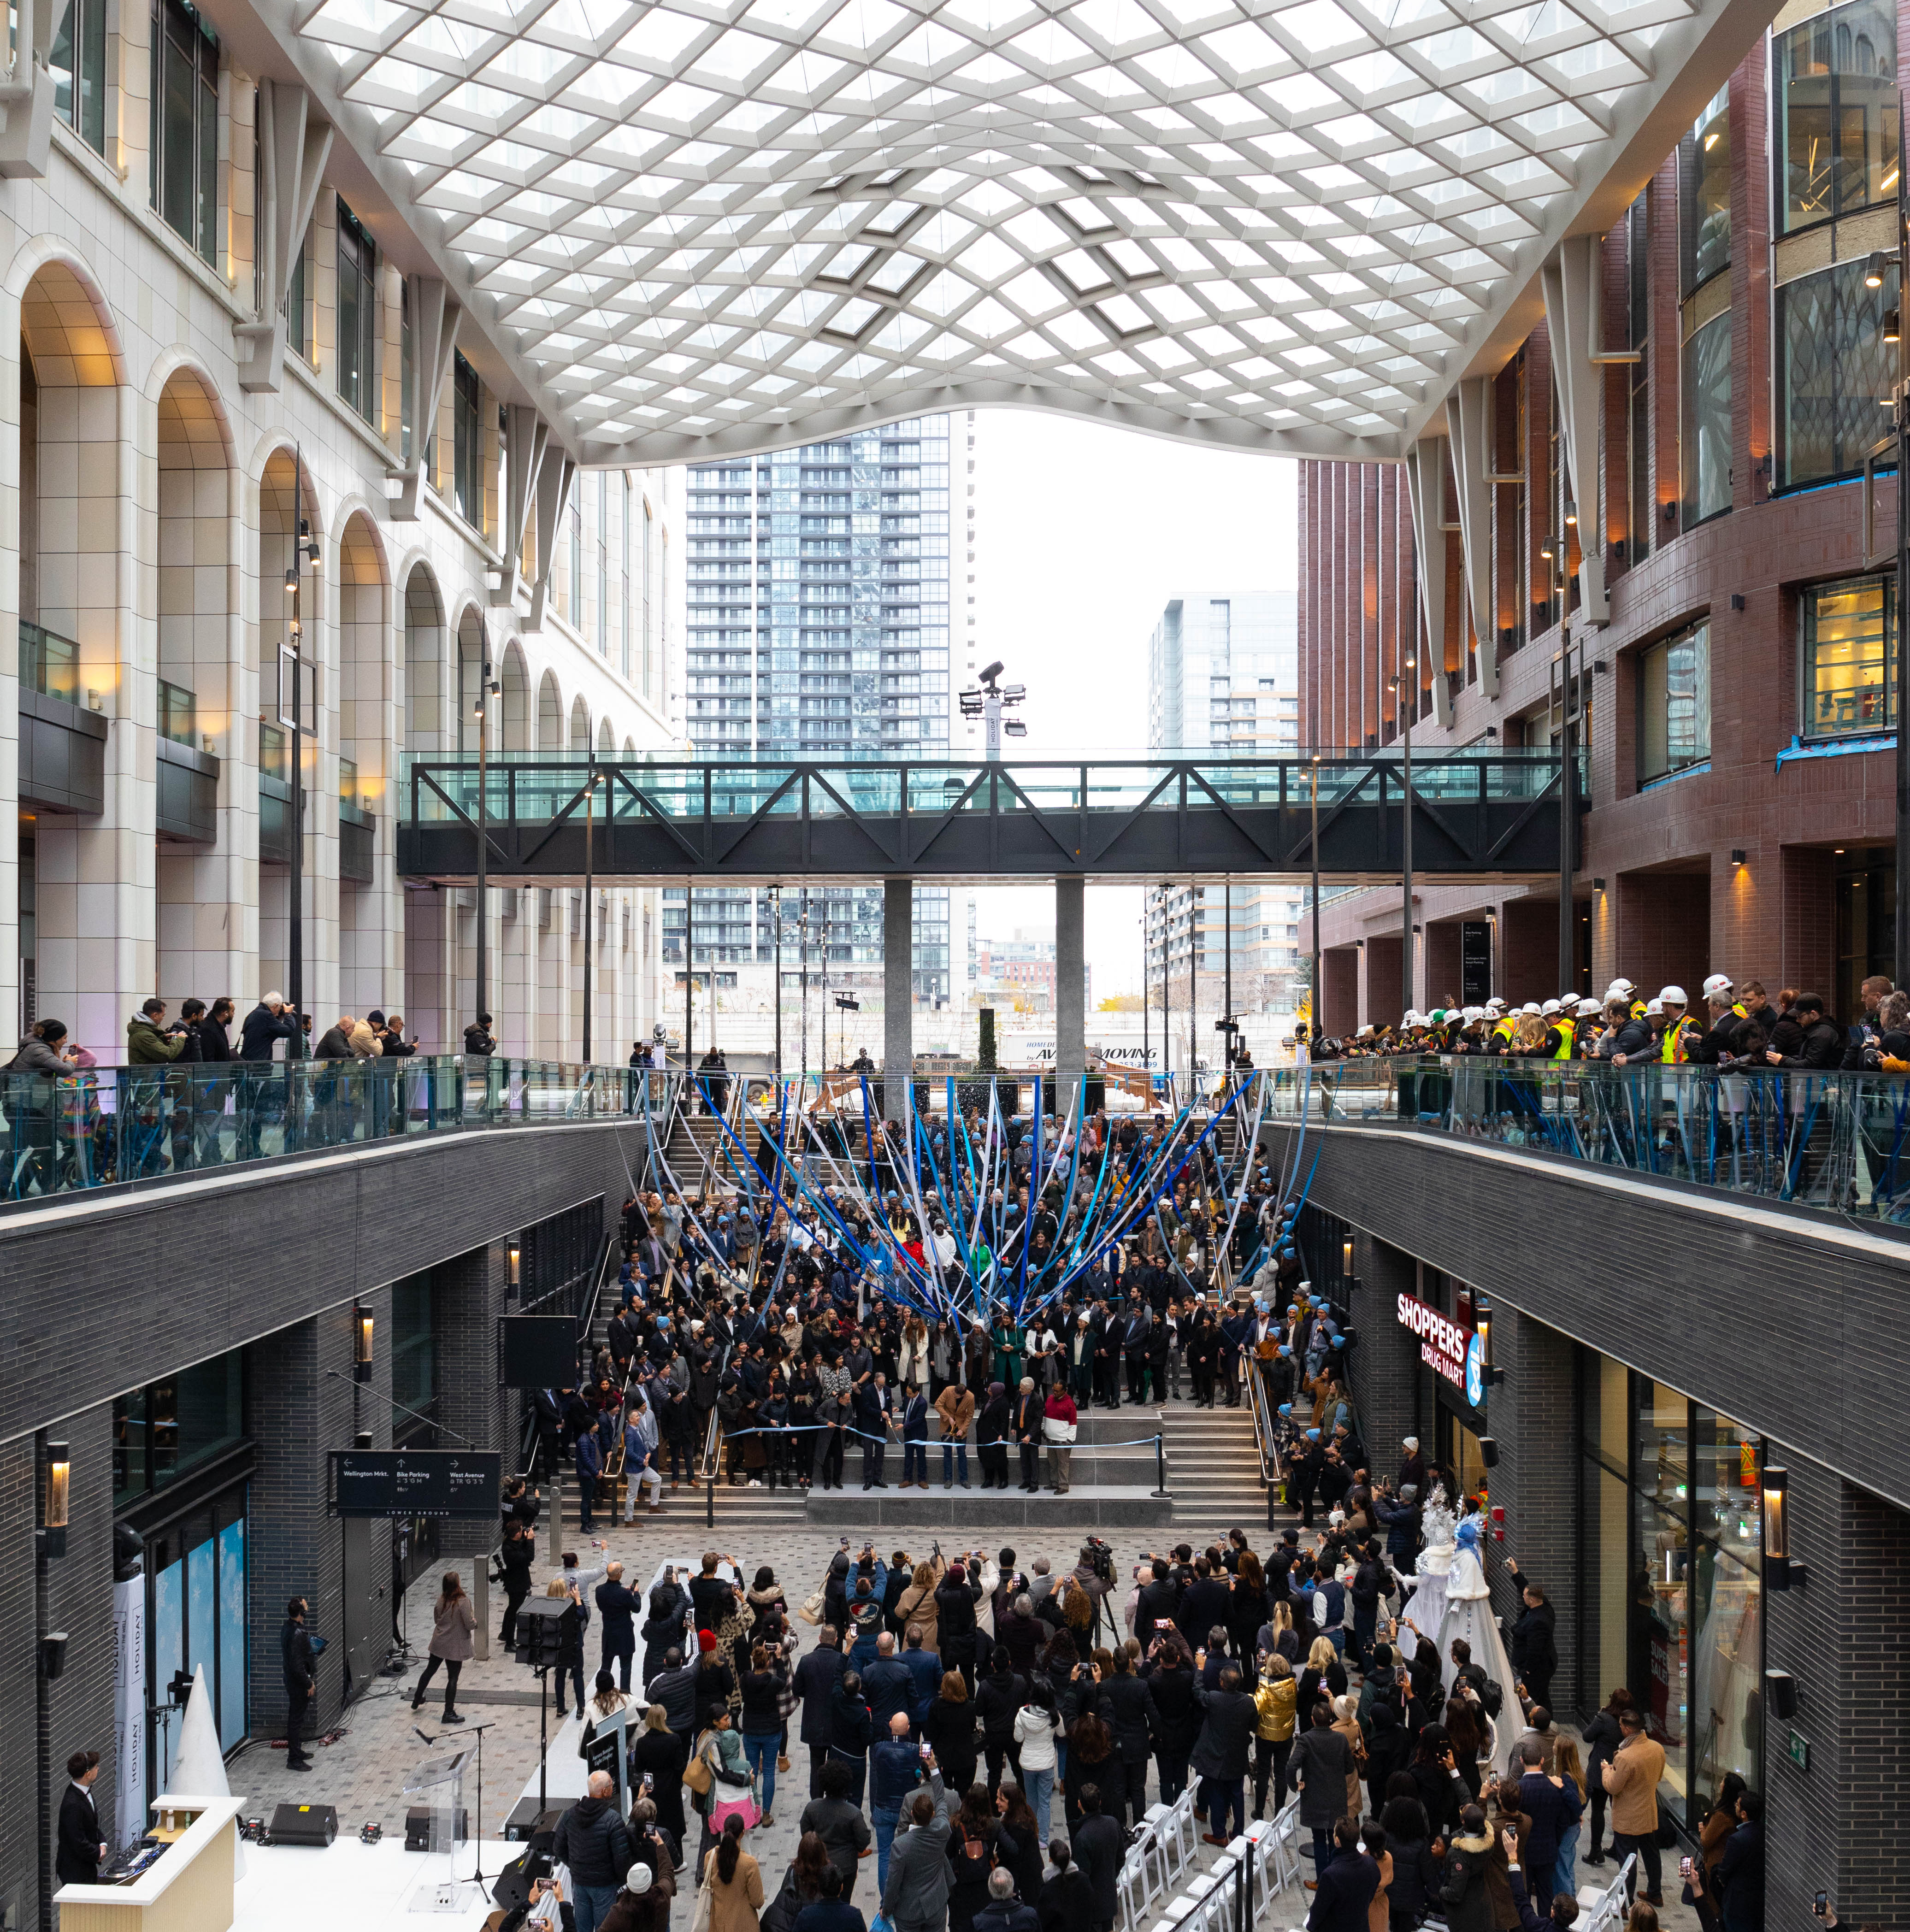
• Sign up for the Daily Digest Email!
  • Twitter
  • Facebook
  • Google Plus One
  • RSS

REIT REPORT

REIT news, Real Estate Investment Trusts, Canadian REIT News, REIT Stocks Canada

  • Home
  • Headlines
  • Daily Digest Email
  • Canadian REITs

Choice Properties Real Estate Investment Trust Declares Cash Distribution for the Month of May, 2023

May 18, 2023 By Business Wire

Not for distribution to U.S. News Wire Services or dissemination in the United States.

TORONTO–(BUSINESS WIRE)–#valueforgenerations–Choice Properties Real Estate Investment Trust (“Choice Properties”) (TSX: CHP.UN) announced today that the trustees of Choice Properties have declared a cash distribution for the month of May, 2023 of $0.0625 per trust unit, representing $0.75 per trust unit on an annualized basis, payable on June 15, 2023 to Unitholders of record at the close of business on May 31, 2023.

About Choice Properties Real Estate Investment Trust

Choice Properties is a leading Real Estate Investment Trust that creates enduring value through the ownership, operation and development of high-quality commercial and residential properties.

We believe that value comes from creating spaces that improve how our tenants and communities come together to live, work, and connect. We strive to understand the needs of our tenants and manage our properties to the highest standard. We aspire to develop healthy, resilient communities through our dedication to social, economic, and environmental sustainability. In everything we do, we are guided by a shared set of values grounded in Care, Ownership, Respect and Excellence.

For more information, visit Choice Properties’ website at www.choicereit.ca and Choice Properties’ issuer profile at www.sedar.com.

Contacts

For further information:


Mario Barrafato

Chief Financial Officer

Choice Properties REIT

(416) 628-7872

Mario.Barrafato@choicereit.ca

1VALET Announces Closing of Oversubscribed $7 Million SAFE Financing Round.

May 17, 2023 By Business Wire

Concluded during the company’s previous fiscal year, the oversubscribed $7 Million SAFE Round will expedite 1VALET’s expansion of their security integrator network and supply chain, while also driving the addition of new revenue-generating features for users of their smart building platform.

OTTAWA, Ontario–(BUSINESS WIRE)–Canadian smart building platform leader 1VALET announced today the successful closure of an oversubscribed $7 Million SAFE round in its previous fiscal year.

The oversubscription of shares is a testament to the proptech firm’s remarkable growth and momentum, particularly over the past year. Supported by strategic partnerships with security integrators, telecommunication companies, and other industry leaders, the company is committed to building upon its strong track record of revenue growth. Over the past five years, 1VALET has achieved a remarkable Compound Annual Growth Rate (CAGR) of approximately 150%.

This investment round will empower 1VALET to further enhance shareholder value by expanding its relationship with Rogers and Shaw, strategically expanding its security integrator network, reinforcing its robust supply chain, and introducing new features to its smart building platform. These advancements will enable the company to unlock additional revenue-generating opportunities for its users and help maintain 1VALET’s position at the forefront of innovation.

“The exceptional value we have been able to create for multi-family owners and asset managers, as well as our own stakeholders and partners, has been remarkable,” said 1VALET CEO Jean-Pierre Poulin. “Our growth over the past five years has been outstanding, and we’re eager and excited to continue to compound this success over the coming years.”

Renowned for its disruptive smart building operating system and proprietary hardware, 1VALET sells its innovative products directly and through multiple distribution channels.

To learn more about how 1VALET is helping hundreds of developers and asset managers grow their NOI, streamline operations, and boost resident engagement, contact our Sales Team at sales@1valet.com.

About 1VALET

1VALET is a leading smart Building Operating System that integrates IoT technologies to better connect residents to their community, and easily convert multi-family buildings into connected smart communities.

By centralizing building systems into one web-based dashboard and empowering tenants with a leading Resident App, 1VALET can enhance resident engagement, increase NOI, and create safer, smarter communities. To learn more, visit 1VALET.com.

Contacts

Media Contact

Hugo Moreira

Marketing Communications Manager

hmoreira@1valet.com

Slate Grocery REIT Announces Distribution for the Month of May 2023

May 16, 2023 By Business Wire

TORONTO–(BUSINESS WIRE)–Slate Grocery REIT (TSX: SGR.U) (TSX: SGR.UN) (the “REIT”), an owner and operator of U.S. grocery-anchored real estate, announced today that the Board of Trustees has declared a distribution for the month of May 2023 of U.S.$0.072 per class U unit of the REIT (“Class U Units”), or U.S.$0.864 on an annualized basis.

Holders of Class U Units may elect to receive their distribution in Canadian dollars and should contact their broker to make such an election.

Holders of class A units of the REIT (“Class A Units”) will receive a distribution equal to the Canadian dollar equivalent (based on the U.S./Canadian dollar exchange rate at the time of payment of the distribution) of U.S.$0.072 per Class A Unit, unless the unitholder has elected to receive distributions in U.S. dollars. Holders of class I units of the REIT (“Class I Units”) will receive a distribution of U.S.$0.072 per Class I Unit, unless the unitholder has elected to receive distributions in Canadian dollars. Holders of units of subsidiaries of the REIT that are exchangeable into Class U Units (“Exchangeable Units”) will receive a distribution of U.S.$0.072 per unit.

If a holder of Class U Units or Class I Units elects to receive distributions in Canadian dollars, the holder will receive the Canadian dollar equivalent amount of the distribution being paid on the Class U Units or Class I Units, as applicable, based on the U.S./Canadian dollar exchange rate at the time of payment of the distribution.

Distributions on all unit classes of the REIT, and distributions on Exchangeable Units, will be payable on June 15, 2023 to unitholders of record as of the close of business on May 31, 2023.

About Slate Grocery REIT (TSX: SGR.U / SGR.UN)

Slate Grocery REIT is an owner and operator of U.S. grocery-anchored real estate. The REIT owns and operates approximately U.S. $2.4 billion of critical real estate infrastructure across major U.S. metro markets that communities rely upon for their daily needs. The REIT’s resilient grocery-anchored portfolio and strong credit tenants provide unitholders with durable cash flows and the potential for capital appreciation over the longer term. Visit slategroceryreit.com to learn more about the REIT.

About Slate Asset Management

Slate Asset Management is a global alternative investment platform targeting real assets. We focus on fundamentals with the objective of creating long-term value for our investors and partners. Slate’s platform has a range of real estate and infrastructure investment strategies, including opportunistic, value add, core plus and debt investments. We are supported by exceptional people and flexible capital, which enable us to originate and execute on a wide range of compelling investment opportunities. Visit slateam.com to learn more.

Forward-Looking Statements

Certain information herein constitutes “forward-looking information” as defined under Canadian securities laws which reflect management’s expectations regarding objectives, plans, goals, strategies, future growth, results of operations, performance, business prospects and opportunities of the REIT. The words “plans”, “expects”, “does not expect”, “scheduled”, “estimates”, “intends”, “anticipates”, “does not anticipate”, “projects”, “believes”, or variations of such words and phrases or statements to the effect that certain actions, events or results “may”, “will”, “could”, “would”, “might”, “occur”, “be achieved”, or “continue” and similar expressions identify forward-looking statements. Such forward-looking statements are qualified in their entirety by the inherent risks and uncertainties surrounding future expectations.

Forward-looking statements are necessarily based on a number of estimates and assumptions that, while considered reasonable by management as of the date hereof, are inherently subject to significant business, economic and competitive uncertainties and contingencies. When relying on forward-looking statements to make decisions, the REIT cautions readers not to place undue reliance on these statements, as forward-looking statements involve significant risks and uncertainties and should not be read as guarantees of future performance or results, and will not necessarily be accurate indications of whether or not the times at or by which such performance or results will be achieved. A number of factors could cause actual results to differ, possibly materially, from the results discussed in the forward-looking statements. Additional information about risks and uncertainties is contained in the filings of the REIT with securities regulators.

SGR-Dist

Contacts

For Further Information
Investor Relations

+1 416 644 4264

ir@slateam.com

Lafarge Canada Expands Collaboration with 4Refuel to Enhance Decarbonization Commitment by Implementing Renewable Diesel (R50) in the Manitoba Region

May 15, 2023 By Business Wire

KEY TAKEAWAYS


  • Manitoba is Holcim’s second market to use renewable diesel as part of its carbon reduction strategies
  • Reduce up to 38.9% CO2 Emission (Scope 3) year-over-year

WINNIPEG, Manitoba–(BUSINESS WIRE)–Lafarge Canada, a leader in sustainable and innovative building solutions, announced today its continued partnership with 4Refuel, a provider of sustainable fuel solutions, to advance its commitment to reducing carbon emissions. Lafarge and 4Refuel will collaborate to implement renewable diesel in Lafarge’s operations in its Manitoba market area.

Renewable diesel is a sustainable alternative to traditional diesel fuel that is made from waste oils and fats and produces lower emissions than conventional diesel.

Lafarge’s adoption of renewable diesel (R50) is in line with its pledge to become a Net-zero corporation by decreasing its carbon footprint and advocating for sustainability. With the utilization of renewable diesel, Lafarge is targeting that its reduction in CO2 emissions (scope 3) will lead to a substantial decrease in greenhouse gas emissions, enhance air quality, and encourage the responsible management of the environment.

“Switching to renewable diesel (R50) is a significant step forward in our sustainability journey,” said Tina Larson, Vice President, Manitoba & Saskatchewan, Lafarge Canada, Western Canada. “We recognize that climate change is one of the most significant challenges facing our planet, and we are committed to doing our part to reduce our impact on the environment. We believe that renewable diesel is an excellent solution to help us achieve our sustainability goals while maintaining the high level of performance that our customers expect.”

The shift to renewable diesel will have no impact on Lafarge’s operations or the quality of its products and services. Renewable diesel is compatible with existing diesel engines and infrastructure, making it an easy and effective way for businesses to reduce their carbon footprint. Lafarge will reduce up to 46 tonnes of CO2 emissions (Scope 3) per year by adopting renewable diesel in Manitoba; this is equivalent to 5,176 gallons of gasoline consumed or 9 homes electricity use for one year.

Lafarge’s transition to renewable diesel began in November 2022 with the Greater Vancouver Area market and it is part of a larger sustainability initiative that includes reducing waste, conserving water, and promoting energy efficiency. The Manitoba market will begin its adoption by making use of the renewable diesel fuel during the warmer months, from May to October.

“We are thrilled to continue our sustainability partnership with Lafarge by expanding our renewable diesel (R50) offering into additional Lafarge markets. Renewable diesel is a turn-key solution to reduce lifecycle-based emissions, and we are committed to serving our customers with low-carbon alternatives,” says Lauren Foulkes, Director of Sustainability, 4Refuel.

Lafarge Canada is proud to be a leader in sustainability and will continue to explore new ways to reduce its environmental impact; it encourages other businesses to join the Net-zero journey and make a commitment towards creating a cleaner and healthier future for all.

About Lafarge Canada Inc.

Lafarge is Canada’s largest provider of sustainable and innovative building solutions including Aggregates, Cement, Ready Mix and Precast Concrete, Asphalt and Paving, and Road and Civil Construction. With over 6,900 employees and 400 sites across the country, Lafarge provides green products to build the infrastructure and communities where Canadians live and work.

As a member of Holcim Group, Lafarge’s purpose is to build progress for people and the planet.

www.lafarge.ca

About 4refuel

4Refuel is North America’s largest mobile onsite refueling and fuel management technology company. Operating for over 25 years, 4Refuel is a trusted partner to sustainable fuel management operations with 24/7/365 reliable, convenient, and safe solutions. 4Refuel is pioneering the energy transition by offering distribution of a full suite of low-carbon liquid and gaseous alternative fuel products. We serve diverse markets, including construction, commercial transport, mining, agriculture, and marine. 4Refuel is a wholly owned subsidiary of Finning International.

4refuel.com

Contacts

Media Contact

Adetutu Opeyemi

External Communications and Marketing Advisor, Eastern Canada

Lafarge Canada Inc.

adetutu.opeyemi@lafarge.com

Virginia MacFabe

Manager, Marketing Programs

4Refuel

virginia.macfabe@4refuel.com

Trez Capital Announces Key Leadership Changes, Ushering in Next Chapter of Growth

May 12, 2023 By Business Wire

Morley Greene, Founder of Trez Capital and Industry Leader, Passes the Torch to New Firm Leadership

VANCOUVER, British Columbia & DALLAS–(BUSINESS WIRE)–Trez Capital, a leading provider of private commercial real estate debt and equity financing solutions in Canada and the United States, announced today that after almost 26 years as Chairman and Chief Executive Officer, firm founder Morley Greene will transition into the role of Executive Chairman. Executive leaders John D. Hutchinson and Dean Kirkham, will serve as Co-Chief Executive Officers, taking over day-to-day leadership of the firm.

“Building Trez Capital has been the greatest, most fulfilling and transformational professional experience of my life,” said Greene. “It has been an incredible 26-year journey for me, but the story does not stop here – the new chapter for Trez Capital is about to begin.”

Trez Capital’s partnership continues to undergo changes that bring new perspectives, skills and varied expertise. After 13 years with the firm holding progressively senior positions and 20 years of experience in the home building business, Hutchinson joined the partnership in fall 2021. More recently, in early 2023, Kirkham and John Maragliano were welcomed as partners. Kirkham joined Trez Capital in 2016 as Chief Credit Officer and has since taken on increasingly senior roles, culminating in his most recent position as President and Chief Operating Officer. Maragliano joined Trez Capital in 2021 as Chief Financial Officer, bringing 25 years of experience in the financial services industry. With this executive team’s diversified capabilities, Trez Capital has the right leaders in place to ensure its future success.

“My confidence to transition leadership at this time is a testament to the strength and vision of the firm, creating space for our leaders to emerge, fostering innovation and paving the way for Trez Capital to spread its wings and soar higher in the next chapter of growth and success,” added Greene.

In his new role as Co-Chief Executive Officer and Global Head of Origination, Hutchinson will continue focusing on the firm’s debt and equity origination business. As Co-Chief Executive Officer and President, Kirkham will continue focusing on the key pillars of risk and capital raising for the firm. Together, they will set the mission, vision, values and strategic direction of the firm. Additionally, Maragliano will become Chief Operating Officer, paired with his current role as Chief Financial Officer.

“We are focused on growing the firm which will continue to come from our core financing business and the new offerings we have recently brought to the market under our joint leadership,” stated Hutchinson.

In his role as Founder and Executive Chairman, Greene will continue providing valuable mentorship to the executive team, while also actively contributing to key strategic initiatives. Furthermore, he will prioritize fostering strong relationships with borrowers and investors, which have been an essential component of the organization’s success over time.

Kirkham said, “For several years now Trez Capital has strategically expanded our team of talented leaders who will uphold and build upon the legacy established by Morley, driving our organization forward with purpose and vision. Most importantly, we will continue to put our investors first in everything we do.”

“Trez Capital’s future has never been clearer, and this sound executive leadership team will continue building upon our reputation of providing innovative financing for commercial properties in major centers throughout Canada and the U.S. while providing exceptional returns for our investors,” concluded Greene.

About Trez Capital:

Founded in 1997, Trez Capital is a diversified real estate investment firm and preeminent provider of commercial real estate debt and equity financing solutions in Canada and the United States. Trez Capital offers private and institutional investors strategies to invest in a variety of opportunistic, fully secured mortgage investment funds, syndication offerings and real estate joint-venture investments; and provides property developers with quick approvals on flexible short- to mid-term financing.

With offices across North America, Trez Corporate Group has over $5.4* billion CAD in assets under management and has funded over 1,700 transactions totalling more than $17 billion CAD since inception. For more information, visit www.trezcapital.com. (*Trez Corporate Group AUM includes assets held by all Trez-related entities as well as $3.0 billion Manager AUM (Trez Capital Fund Management Limited Partnership)).

Contacts

Trez Capital Media Contact, Sarah Haney, 647.460.2029, sarahh@trezcapital.com

Dala Communications for Trez Capital: Leah Williams, 214.302.9699, leah@dalacommunications.com

AECOM to conduct PFAS investigation and remediation for U.S. Army National Guard facilities nationwide

May 12, 2023 By Business Wire

DALLAS–(BUSINESS WIRE)–AECOM (NYSE: ACM), the world’s trusted infrastructure consulting firm, announced today that its joint venture was awarded a contract from the U.S. Army Corps of Engineers (USACE) to deliver per-and polyfluoroalkyl substances (PFAS) remedial investigations, feasibility studies, removal actions, and associated work at Army National Guard (ARNG) facilities nationwide. This work builds on AECOM’s prior experience executing extensive preliminary PFAS investigations at ARNG facilities for USACE.

“PFAS present a social and environmental challenge, one we’re tackling aggressively through our Sustainable Legacies strategy,” said Lara Poloni, AECOM’s president. “Our track record in PFAS extends over two decades, and our teams bring deep technical excellence and a drive to continuously innovate solutions as we partner with new and long-term clients to address the impact of PFAS on communities.”

Using the latest in analytics and treatment technologies, the joint venture will work with USACE to define nature and extent for regulated PFAS at ARNG facilities nationwide, take quick action where necessary, and design and implement long-term treatment solutions.

“The ARNG and all of the Department of Defense continue to take proactive measures against PFAS in the environment, and we’re proud to support them as a leader in PFAS remediation,” said Frank Sweet, chief executive of AECOM’s global Environment business. “Our suite of PFAS services, spanning characterization, evaluation, mitigation and destruction, and our ever-growing team of global experts enable us to provide clients with powerful PFAS capabilities, which we expect to be especially valuable as countries around the world take further action to address and limit PFAS.”

PFAS are a diverse group of synthetic chemicals used for over 50 years in industrial applications that, due to distinct properties, can prove difficult to break down and are subject to increasingly stringent federal regulations. AECOM brings an unrivalled depth and breadth of experience, having helped clients address the impact of PFAS since 2001 and on approximately 500 sites globally.

About AECOM

AECOM (NYSE: ACM) is the world’s trusted infrastructure consulting firm, delivering professional services throughout the project lifecycle – from advisory, planning, design and engineering to program and construction management. On projects spanning transportation, buildings, water, new energy and the environment, our public- and private-sector clients trust us to solve their most complex challenges. Our teams are driven by a common purpose to deliver a better world through our unrivaled technical and digital expertise, a culture of equity, diversity and inclusion, and a commitment to environmental, social and governance priorities. AECOM is a Fortune 500 firm and its Professional Services business had revenue of $13.1 billion in fiscal year 2022. See how we are delivering sustainable legacies for generations to come at aecom.com and @AECOM.

Forward-Looking Statements

All statements in this communication other than statements of historical fact are “forward-looking statements” for purposes of federal and state securities laws, including any statements of the plans, strategies and objectives for future operations, profitability, strategic value creation, risk profile and investment strategies, and any statements regarding future economic conditions or performance, and the expected financial and operational results of AECOM. Although we believe that the expectations reflected in our forward-looking statements are reasonable, actual results could differ materially from those projected or assumed in any of our forward-looking statements. Important factors that could cause our actual results, performance and achievements, or industry results to differ materially from estimates or projections contained in our forward-looking statements include, but are not limited to, the following: our business is cyclical and vulnerable to economic downturns and client spending reductions; limited control over operations that run through our joint venture entities; liability for misconduct by our employees or consultants; failure to comply with laws or regulations applicable to our business; maintaining adequate surety and financial capacity; potential high leverage and inability to service our debt and guarantees; ability to continue payment of dividends; exposure to political and economic risks in different countries, including tariffs; currency exchange rate and interest fluctuations; retaining and recruiting key technical and management personnel; legal claims; inadequate insurance coverage; environmental law compliance and adequate nuclear indemnification; unexpected adjustments and cancellations related to our backlog; partners and third parties who may fail to satisfy their legal obligations; AECOM Capital real estate development projects; managing pension cost; cybersecurity issues, IT outages and data privacy; risks associated with the expected benefits and costs of the sale of our Management Services and self-perform at-risk civil infrastructure, power construction and oil and gas construction businesses, including the risk that any contingent purchase price adjustments from those transactions could be unfavorable and result in lower aggregate cash proceeds and any future proceeds owed to us under those transactions could be lower than we expect; as well as other additional risks and factors that could cause actual results to differ materially from our forward-looking statements set forth in our reports filed with the Securities and Exchange Commission. Any forward-looking statements are made as of the date hereof. We do not intend, and undertake no obligation, to update any forward-looking statement.

Contacts

Media Contact:

Brendan Ranson-Walsh

Senior Vice President, Global Communications

1.213.996.2367

Brendan.Ranson-Walsh@aecom.com

Investor Contact:

Will Gabrielski

Senior Vice President, Finance, Treasurer

1.213.593.8208

William.Gabrielski@aecom.com

CORRECTION: InterRent REIT Reports Q1 2023 Same Property NOI Growth of 11.4% and the Release of Third Annual Sustainability Report

May 11, 2023 By Business Wire

NOT FOR DISTRIBUTION TO UNITED STATES NEWSWIRE SERVICES OR FOR DISSEMINATION IN THE UNITED STATES

OTTAWA, Ontario–(BUSINESS WIRE)–InterRent Real Estate Investment Trust (TSX-IIP.UN) (“InterRent” or the “REIT”) today reported financial results for the first quarter ended March 31, 2023. This press release has been amended and restated to correct the commentary regarding same-property NOI growth in the previous press release issued at 7:30 am ET on Tuesday, May 9, 2023.

AMR growth and occupancy gains drive robust NOI margin expansion of 90bps over Q1 2022

  • Same property occupancy for March 2023 was 96.9%, an increase of 140 basis points when compared to March 2022, inline with December 2022, helped drive same property NOI for the quarter to $35.8 million, an increase of $3.7 million, or 11.4%, over Q1 2022.
  • Total occupancy for March 2023 was 96.8%, an increase of 130 basis points when compared to March 2022, which helped push proportionate NOI for the quarter to $36.3 million, an increase of $4.2 million, or 12.9%, over Q1 2022.
  • Total portfolio and same property NOI margin of 62.9% for the quarter is a 90bps expansion over Q1 2022.
  • Strong demand continued through the quarter, resulting in Average Monthly Rent (AMR) growth in March 2023 of 7.1% for the total portfolio and 6.7% for the same property portfolio, as compared to March 2022.
  • Funds from Operations (FFO) of $18.9 million ($0.130 per Unit – diluted) in Q1 2023 is down 0.8% overall and 2.3% on a per Unit basis compared to Q1 2022 as a result of interest rate increases through 2022 and into the first quarter of 2023.
  • Reported on 2022 sustainability objectives and goals with the concurrent release of the 3rd annual InterRent sustainability report, sharing the progress made as the REIT continues to execute on its sustainability strategy.

Strong revenue and NOI growth helps offset new norm of higher financing costs

As of March 31, 2023, InterRent had proportionate ownership in 12,689 suites, up 2.0% from 12,445 as of March 2022. Including properties that the REIT owns in its joint ventures, InterRent owned or managed 13,840 suites at March 31, 2023. At 96.8%, the March 2023 occupancy rate in InterRent’s portfolio improved 130bps over March 2022 and is flat from December 2022. Within the same property portfolio, March 2023 occupancy was 96.9%, an increase of 140bps from March 2022 and a 10bps decrease from December 2022. AMR growth across the total portfolio was 7.1% for March 2023 as compared to March 2022, while same property AMR increased by an impressive 6.7% for the same period.

With record setting immigration in 2022 and continuing ambitious federal targets for 2023, strong leasing demand continues to drive AMR growth and strong occupancy numbers, resulting in total portfolio operating revenue growth of 11.3% over Q1 2022. Within the same property portfolio, these same factors have grown operating revenues by 9.8% compared to Q1 2022. NOI margin for the overall and same property portfolios were 62.9% for the quarter, a 90-basis points expansion over the same period last year.

In the quarter, the REIT increased its share of CMHC insured mortgages to 83%, from 82% at December 2022 and 71% at March 2022, providing added protection against any liquidity risks in the market. The average term to maturity for the mortgages sits at 5.1 years, a marginal decrease from 5.2 years at December 2022 and up from 4.5 years at March 2022. Despite a large rate swap maturing during the quarter, the REIT’s variable rate exposure ended the quarter at 4%, a decrease from the 16% exposure at the end of Q1 2022. Financing activities during the quarter and changes to variable rates have resulted in the weighted average cost of mortgage debt increasing to 3.38% (+16bps from December 2022). Financing costs in Q1 2023 were consistent with Q4 2022 and came in at $13.9 million relative to $9.7 million in Q1 2022. The REIT has the majority of its remaining 2023 maturing mortgages at various stages of the review/approval process with CMHC. With the changes CMHC’s recently announced to their insurance programs (including MLI Select), the proactive management of renewals and up-financings will minimize the impact of the change in premiums for 2023.

Net income for the quarter was $82.8 million, a decrease of $11.9 million compared to Q1 2022. This difference was due primarily to a $16.0 million difference in the unrealized gain/(loss) on the revaluation of financial liabilities (moving from a $10.0 million gain to a $6.0 million loss) and a $4.2 million increase in financing costs, offset by the increase in NOI and a $4.3 million increase in fair value gain on investment properties.

As a result of seasonality, FFO and AFFO typically decrease from Q4 to Q1 but both are up from $0.129 and $0.110 per Unit (diluted) recorded for Q4 2022. FFO on a per Unit (diluted) basis for the three months ended March 31, 2023 shrunk by 2.3% to $0.130 per Unit (diluted) compared to Q1 2022. Similarly, AFFO for the three months ended March 31, 2023 decreased by 5.8% to $0.113 per Unit (diluted) compared to 2022.

The Slayte

The Slayte development in Ottawa, the REIT’s first office conversion project, is nearing completion with occupancy quickly approaching the 50% mark despite lease-up having mainly occurred during the weaker winter rental months. There continues to be strong momentum post quarter and demand is anticipated to continue and strengthen during the summer months. Takeout financing is underway with CMHC under its MLI Select program, where the community achieved the highest level in the program by scoring on all three criteria: energy efficiency, accessibility, and affordability.

2022 sustainability report highlights the REIT’s significant progress

InterRent is concurrently publishing its 2022 sustainability report alongside its Q1 2023 results. The intent with this report is to provide a status update on the social and environment goals initially established in its inaugural 2020 report and subsequent updates in its 2021 report. The report is available for download in the sustainability section of InterRent’s website (https://www.interrentreit.com/sustainability).

Commenting on the results published today, Brad Cutsey, President & CEO of InterRent, said: “We are pleased to have returned to double-digit same-property NOI growth during the quarter with our core markets stronger than ever. The Slayte is off to a promising start, already reaching 50% occupancy and with the strong summer leasing months yet to come.

Despite facing headwinds from higher financing costs, we have taken incremental steps to improve the resiliency of our debt portfolio. We are pleased to see further signs of market improvement with the Bank of Canada pausing rate hikes, and a modest pick-up in transaction activity.

We are also delighted to have published our third annual sustainability report, which highlights the significant progress we’ve made toward our goals. We will continue to enhance and execute on our sustainability strategy that will not only benefit our communities and the environment, but also drive returns for our stakeholders.”

Financial Highlights

Selected Consolidated Information

In $000’s, except per Unit amounts

and other non-financial data

3 Months Ended

March 31, 2023

3 Months Ended

March 31, 2022

Change

Total suites


12,689(1

)


12,445(1

)

+2.0%

Average rent per suite (March)

$

1,504


$

1,404


+7.1%

Occupancy rate (March)


96.8

%


95.5

%

+130 bps

Proportionate operating revenues

$

57,740


$

51,877


+11.3%

Proportionate net operating income (NOI)

$

36,321


$

32,169


+12.9%

NOI %


62.9

%


62.0

%

+90 bps

Same Property average rent per suite (March)

$

1,498


$

1,404


+6.7%

Same Property occupancy rate (March)


96.9

%


95.5

%

+140 bps

Same Property proportionate operating revenues

$

56,915


$

51,814


+9.8%

Same Property proportionate NOI

$

35,781


$

32,129


+11.4%

Same Property NOI %


62.9

%


62.0

%

+90 bps

Net Income

$

82,761


$

94,632


-12.5

%

Funds from Operations (FFO)

$

18,910


$

19,067


-0.8

%

FFO per weighted average unit – diluted

$

0.130


$

0.133


-2.3

%

Adjusted Funds from Operations (AFFO)

$

16,430


$

17,267


-4.8

%

AFFO per weighted average unit – diluted

$

0.113


$

0.120


-5.8

%

Distributions per unit

$

0.0900


$

0.0855


+5.3%

Adjusted Cash Flow from Operations (ACFO)

$

8,194


$

13,170


-37.8

%

Debt-to-GBV


38.0

%


36.4

%

+160 bps

Interest coverage (rolling 12 months)

2.52x

3.31x

-0.79x

Debt service coverage (rolling 12 months)

1.59x

1.84x

-0.25x

(1)

Represents 12,021 (2022 – 11,965) suites fully owned by the REIT, 1,214 (2022 – 960) suites owned 50% by the REIT, and 605 (2022 – nil) suites owned 10% by the REIT.

Conference Call

Management will host a webcast and conference call to discuss these results and current business initiatives on Tuesday, May 9, 2023 at 10:00 AM EST. The webcast will be accessible at: https://www.interrentreit.com/2023-q1-results. A replay will be available for 7 days after the webcast at the same link. The telephone numbers for the conference call are 1-888-886-7786 (toll free) and 416-764-8687 (international). No access code required.

About InterRent

InterRent REIT is a growth-oriented real estate investment trust engaged in increasing Unitholder value and creating a growing and sustainable distribution through the acquisition and ownership of multi-residential properties.

InterRent’s strategy is to expand its portfolio primarily within markets that have exhibited stable market vacancies, sufficient suites available to attain the critical mass necessary to implement an efficient portfolio management structure, and offer opportunities for accretive acquisitions.

InterRent’s primary objectives are to use the proven industry experience of the Trustees, Management and Operational Team to: (i) grow both funds from operations per Unit and net asset value per Unit through investments in a diversified portfolio of multi-residential properties; (ii) provide Unitholders with sustainable and growing cash distributions, payable monthly; and (iii) maintain a conservative payout ratio and balance sheet.

*Non-GAAP Measures

InterRent prepares and releases unaudited quarterly and audited consolidated annual financial statements prepared in accordance with IFRS (GAAP). In this and other earnings releases, as a complement to results provided in accordance with GAAP, InterRent also discloses and discusses certain non-GAAP financial measures, including Proportionate Results, Gross Rental Revenue, NOI, Same Property results, Repositioned Property results, FFO, AFFO, ACFO and EBITDA. These non-GAAP measures are further defined and discussed in the MD&A dated May 9, 2023, which should be read in conjunction with this press release. Since Proportionate Results, Gross Rental Revenue, NOI, Same Property results, Repositioned Property results, FFO, AFFO, ACFO and EBITDA are not determined by GAAP, they may not be comparable to similar measures reported by other issuers. InterRent has presented such non-GAAP measures as Management believes these measures are relevant measures of the ability of InterRent to earn and distribute cash returns to Unitholders and to evaluate InterRent’s performance. These non-GAAP measures should not be construed as alternatives to net income (loss) or cash flow from operating activities determined in accordance with GAAP as an indicator of InterRent’s performance.

Cautionary Statements

The comments and highlights herein should be read in conjunction with the most recently filed annual information form as well as our consolidated financial statements and management’s discussion and analysis for the same period. InterRent’s publicly filed information is located at www.sedar.com.

This news release contains “forward-looking statements” within the meaning applicable to Canadian securities legislation. Generally, these forward-looking statements can be identified by the use of forward-looking terminology such as “plans”, “anticipated”, “expects” or “does not expect”, “is expected”, “budget”, “scheduled”, “estimates”, “forecasts”, “intends”, “anticipates” or “does not anticipate”, or “believes”, or variations of such words and phrases or state that certain actions, events or results “may”, “could”, “would”, “might” or “will be taken”, “occur” or “be achieved”. InterRent is subject to significant risks and uncertainties which may cause the actual results, performance or achievements to be materially different from any future results, performance or achievements expressed or implied by the forward looking statements contained in this release. A full description of these risk factors can be found in InterRent’s most recently publicly filed information located at www.sedar.com. InterRent cannot assure investors that actual results will be consistent with these forward looking statements and InterRent assumes no obligation to update or revise the forward looking statements contained in this release to reflect actual events or new circumstances.

The Toronto Stock Exchange has not reviewed and does not accept responsibility for the adequacy or accuracy of this release.

Contacts

Investor Relations

investorinfo@interrentreit.com
www.interrentreit.com

Matthews Design Group Announces Milestone Achievement: WELL Precertification Awarded to Vendure Retirement Communities’ Waterview Project

May 10, 2023 By Business Wire

Waterview Retirement Resort will be the first senior living facility in Canada to receive the designation

KELOWNA, British Columbia–(BUSINESS WIRE)–Sustainability and wellness design consulting firm Matthews Design Group (MDG) today announces one of its consulting properties, Vendure Retirement Communities, has been awarded WELL Precertification™ for its Waterview project. The development, located in Nelson, B.C., is the first Senior Living Facility in the country to receive this distinction.

The WELL Precertification distinction was awarded by the International WELL Building Institute (IWBI), the leading authority for transforming health and well-being with its people-first approach to buildings, organizations, and communities, under WELL v2, the latest version of the WELL Building Standard (WELL). It is grounded in a body of evidence-based research that links the connection between the spaces where we spend approximately 90 percent of our time, and the health and well-being impact on the people inside buildings.

“Achieving the WELL Precertification for the Waterview project speaks volumes to the focus on wellness that went into designing this property, and it is our great pleasure to be a part of creating a space that will have a long-lasting positive impact on the health of all occupants,” said Trish Matthews, Principal and CEO of Matthews Design Group. “Matthews Design Group is proud to have worked alongside Vendure properties on this transformative project, which, once complete, will provide a wellness-oriented space that will ensure the well-being of residents and families, and reduce employee stress and burnout. We’d like to congratulate the entire Vendure team on this incredible achievement.”

The population of Canadians aged 85 and older is one of the country’s fastest-growing age groups. As this demographic continues to increase, the demand for safer, accessible living spaces where seniors can age in place will increase exponentially. Under the consultation and guidance of MDG, Vendure has incorporated WELL Building Standards into the design philosophy of the Waterview Retirement Resort to create a sustainable and accessible community where residents can feel safe, healthy and happy for years to come.

WELL Precertification is an optional step in the certification process for WELL projects, which allows registered projects to review the work already completed and confirm that they are on the correct path toward achieving full WELL Certification. Provided the project maintains the standards and directives it has proposed, the Waterview Retirement Resort is on track towards achieving full WELL Certification following its completion.

“At Vendure, creating healthy spaces for our residents is paramount, and this achievement of WELL Precertification for our Waterview project demonstrates our commitment to global leadership in building health,” said Cindy Shaw, Marketing Director of Vendure. “We are deeply appreciative to have Matthews Design Group’s guidance on sustainability and wellness-oriented design throughout this process and we look forward to achieving full WELL Certification. The Waterview development will be a first-class senior facility that fosters the health and well-being of our grandparents, parents, and loved ones, as well as those who work in this space to care for them, and we look forward to welcoming the community.”

The Waterview Retirement Resort consists of five commercial, residential-style development care facilities, offering 125 spacious, well-appointed suites, in one-bedroom, two-bedroom, and studio layouts. It is expected to be completed in 2024.

For more information, visit matthewsdesigngroup.ca.

About Matthews Design Group

Matthews Design Group is driven by the belief that the spaces in which we live, work and play have a profound effect on our health and well-being. By partnering with visionary designers, builders, and developers we craft sustainable, high-performance environments that prioritize occupant wellness. We work closely with green building rating systems to evaluate and certify buildings that meet the highest standards of sustainability and occupant health. For more information, visit www.matthewsdesigngroup.ca.

Contacts

Media
Logan Findlay

Talk Shop Media

logan@talkshopmedia.com
604-440-8999

Slate Grocery REIT Announces Voting Results from 2023 Meeting of Unitholders and Posts Q1 2023 Earnings Call Transcript and Investor Update

May 9, 2023 By Business Wire

TORONTO–(BUSINESS WIRE)–Slate Grocery REIT (TSX: SGR.U) (TSX: SGR.UN) (the “REIT”), an owner and operator of U.S. grocery-anchored real estate, announced today that each of the trustee nominees listed in the management information circular of the REIT dated April 3, 2023 were elected as trustees of the REIT at its annual meeting of the holders (“Unitholders”) of class A units, class I units, class U units and special voting units of the REIT held on May 4, 2023 (the “AGM”). Voting results for the individual trustees are as follows:

Name of Nominee


Voted For


%


Voted Withheld


%

Colum Bastable


16,071,227


92.28


1,344,469


7.72

Christopher Chee


16,435,437


94.37


980,259


5.63

Patrick Flatley


16,420,791


94.29


994,905


5.71

Marc Rouleau


14,630,920


84.01


2,784,776


15.99

Andrea Stephen


16,064,527


92.24


1,351,169


7.76

Mary Vitug


16,426,120


94.32


989,576


5.68

Blair Welch


16,301,179


93.60


1,114,517


6.40

Brady Welch


16,286,768


93.52


1,128,928


6.48

The resolution to re-appoint Deloitte LLP as the auditors of the REIT for the ensuing year and to authorize the trustees to fix the remuneration to be paid by the auditors was approved by 81.29% of the votes.

Final results on all matters voted upon at the AGM will be filed with the Canadian securities regulatory authorities and will be available on the REIT’s SEDAR profile at www.sedar.com.

Q1 2023 Earnings Call Transcript and Investor Update

Slate Grocery REIT’s Q1 2023 earnings call transcript and investor update are now available on the REIT’s website and can be accessed by visiting the following links:

  • Slate Grocery REIT – Q1 2023 earnings call transcript
  • Slate Grocery REIT – Q1 2023 investor update

About Slate Grocery REIT (TSX: SGR.U / SGR.UN)

Slate Grocery REIT is an owner and operator of U.S. grocery-anchored real estate. The REIT owns and operates approximately U.S. $2.4 billion of critical real estate infrastructure across major U.S. metro markets that communities rely upon for their everyday needs. The REIT’s resilient grocery-anchored portfolio and strong credit tenants provide unitholders with durable cash flows and the potential for capital appreciation over the longer term. Visit slategroceryreit.com to learn more about the REIT.

About Slate Asset Management

Slate Asset Management is a global alternative investment platform targeting real assets. We focus on fundamentals with the objective of creating long-term value for our investors and partners. Slate’s platform has a range of real estate and infrastructure investment strategies, including opportunistic, value add, core plus, and debt investments. We are supported by exceptional people and flexible capital, which enable us to originate and execute on a wide range of compelling investment opportunities. Visit slateam.com to learn more.

Forward-Looking Statements

Certain information herein constitutes “forward-looking information” as defined under Canadian securities laws which reflect management’s expectations regarding objectives, plans, goals, strategies, future growth, results of operations, performance, business prospects and opportunities of the REIT. The words “plans”, “expects”, “does not expect”, “scheduled”, “estimates”, “intends”, “anticipates”, “does not anticipate”, “projects”, “believes”, or variations of such words and phrases or statements to the effect that certain actions, events or results “may”, “will”, “could”, “would”, “might”, “occur”, “be achieved”, or “continue” and similar expressions identify forward-looking statements. Such forward-looking statements are qualified in their entirety by the inherent risks and uncertainties surrounding future expectations.

Forward-looking statements are necessarily based on a number of estimates and assumptions that, while considered reasonable by management as of the date hereof, are inherently subject to significant business, economic and competitive uncertainties and contingencies. When relying on forward-looking statements to make decisions, the REIT cautions readers not to place undue reliance on these statements, as forward-looking statements involve significant risks and uncertainties and should not be read as guarantees of future performance or results, and will not necessarily be accurate indications of whether or not the times at or by which such performance or results will be achieved. A number of factors could cause actual results to differ, possibly materially, from the results discussed in the forward-looking statements. Additional information about risks and uncertainties is contained in the filings of the REIT with securities regulators.

SGR-FR

Contacts

For Further Information
Investor Relations

+1 416 644 4264

ir@slateam.com

Dream Office REIT Reports Q1 2023 Results

May 8, 2023 By Business Wire

This press release contains forward-looking information that is based upon assumptions and is subject to risks and uncertainties as indicated in the cautionary note contained within this press release. All dollar amounts in our tables are presented in thousands of Canadian dollars, except for rental rates and per unit amounts, unless otherwise stated.

TORONTO–(BUSINESS WIRE)–DREAM OFFICE REAL ESTATE INVESTMENT TRUST (D.UN-TSX) (“Dream Office REIT”, the “Trust” or “we”) today announced its financial results for the three months ended March 31, 2023 and provided a business update.

OPERATIONAL HIGHLIGHTS

(unaudited)


As at


March 31,


December 31,


March 31,


2023


2022


2022

Total properties(1)


Number of active properties


26


26


29

Number of properties under development


2


2


1

Gross leasable area (in millions of square feet)


5.1


5.1


5.5

Investment properties value

$

2,386,395


$

2,382,883


$

2,596,240

Total portfolio(2)


Occupancy rate – including committed (period-end)(3)


84.0%


84.4%


85.0%

Occupancy rate – in-place (period-end)(3)


80.2%


81.0%


81.7%

Average in-place and committed net rent per square foot (period-end)

$

25.13


$

24.90


$

23.25

Weighted average lease term (years)


5.2


5.3


5.4

See footnotes at end.


Three months ended


March 31,


March 31,


2023


2022

Operating results


Funds from operations (“FFO”)(4)

$

18,857


$

21,043

Comparative properties net operating income (“NOI”)(5)


27,325


26,657

Net rental income


26,172


25,863

Net income


1,378


52,282

Per unit amounts


Diluted FFO per unit(6)

$

0.36


$

0.39

Distribution rate per Unit


0.25


0.25

See footnotes at end.

“After more than three years of COVID, the future of the office sector continues to remain uncertain although there are many ways to achieve value in Dream Office REIT through uses other than as traditional office buildings,” said Michael Cooper, Chief Executive Officer of Dream Office REIT. “The sale of 720 Bay to reduce debt and repurchase units was one such example and we will continue to identify opportunities to increase value for our unitholders.”

  • Net income for the quarter: For the three months ended March 31, 2023, the Trust generated net income of $1.4 million. Included in net income for the three months ended March 31, 2023 are net rental income totalling $26.2 million, net income from our investment in Dream Industrial Real Estate Investment Trust (“Dream Industrial REIT”) totalling $2.4 million and positive fair value adjustments to financial instruments totalling $2.8 million, primarily due to the revaluation of the subsidiary redeemable units as a result of a decrease in the Trust’s unit price, which were partially offset by negative fair value adjustments to investment properties totalling $12.1 million across the portfolio.
  • Diluted FFO per unit(6) for the quarter: For the three months ended March 31, 2023, diluted FFO per unit decreased by $0.03 per unit to $0.36 per unit relative to $0.39 per unit in Q1 2022, driven by higher interest expense (-$0.05), partially offset by higher FFO(4) from our investment in Dream Industrial REIT (+$0.01) and higher comparative properties NOI (+$0.01).
  • Net rental income for the quarter: Net rental income for the three months ended March 31, 2023 increased by $0.3 million relative to the prior year comparative quarter due to higher rental rates across the portfolio and a net decrease in provisions for bad debt during the quarter, partially offset by the sale of 720 Bay Street.
  • Comparative properties NOI(5) for the quarter: For the three months ended March 31, 2023, comparative properties NOI increased by 2.5%, or $0.7 million, over the prior year comparative quarter, primarily driven by higher in-place net rents across the portfolio from rent step ups, higher rates on new leases and renewals and overall higher parking revenues of $0.4 million across the portfolio. Partially offsetting the increases was lower weighted average in-place occupancy in both regions.

    We are actively managing our assets in the Toronto downtown region, which represent 82% of our active portfolio investment property fair values, to improve the quality of the buildings and to continue to improve rental rates in this market. For our assets in the Other markets region, which make up the remaining 18% of our active portfolio investment properties fair value, we are repositioning these assets to improve occupancy and liquidity in the private market.

  • In-place occupancy: Total portfolio in-place occupancy on a quarter-over-quarter basis decreased by 0.8% relative to Q4 2022. In the Other markets region, in-place occupancy decreased by 1.1% relative to Q4 2022 as 36,000 square feet of expiries were partially offset by 11,000 square feet of renewals and 2,000 square feet of new lease commencements. In Toronto downtown, in-place occupancy decreased by 0.6% relative to Q4 2022 as 123,000 square feet of expiries were partially offset by 59,000 square feet of renewals and 48,000 square feet of new lease commencements.

    Total portfolio in-place occupancy on a year-over-year basis decreased from 81.7% at Q1 2022 to 80.2% this quarter due to negative absorption in Toronto downtown and the sale of 720 Bay Street in Q1 2023 along with negative absorption in Other markets, partially offset by the sale of Princeton Tower in Saskatoon in Q3 2022.

  • Lease commencements for the quarter: For the three months ended March 31, 2023, 107,000 square feet of leases commenced in Toronto downtown at $30.47 per square foot, or 22.8% higher than the previous rent in the same space with a weighted average lease term of 7.1 years. In the Other markets region, 13,000 square feet of leases commenced at $21.55 per square foot, or 11.2% higher than the previous rents in the same space with a weighted average lease term of 5.1 years.

    The renewal and relocation rate to expiring rate spread for the quarter was 13.5% above expiring rates on 70,000 square feet of renewals.

BUSINESS UPDATE

As at March 31, 2023, the Trust had $2.9 billion of total assets, $2.4 billion of investment properties and $1.3 billion of total debt.

During Q1 2023, the Trust executed leases totalling approximately 184,000 square feet across our portfolio. In Toronto downtown, the Trust executed 178,000 square feet of leases at a weighted average initial net rent of $31.36 per square foot, or 9.8% higher than the weighted average prior net rent per square foot on the same space, with a weighted average lease term of 5.6 years. In the Other markets region, comprising our properties located in Calgary, Saskatoon, Regina, Mississauga, Scarborough, and the United States (“U.S.”), we executed leases totalling 6,000 square feet at a weighted average net rent of $21.43 per square foot, an increase of 4.4% from the weighted average prior net rent on the same space, with a weighted average lease term of 2.4 years.

To date, the Trust has secured commitments for approximately 705,000 square feet, or 103%, of 2023 full-year natural lease expiries. In Toronto downtown, 33,000 square feet, or approximately 1% of the region’s gross leasable area, is currently being held intentionally vacant for retail repositioning and property improvement purposes.

We remain committed to investing in our well-located real estate portfolio in downtown Toronto to distinguish our assets and attract unique tenants. During 2022, we took 366 Bay Street and 67 Richmond Street West in Toronto offline to fully revitalize the assets. The projects are expected to be completed and ready to lease in Q3 2023 and Q2 2024, respectively. We are currently in active discussions with potential tenants for the buildings on completion. At 67 Richmond Street West, we have completed a lease with a premium restaurant tenant for the ground floor retail space which commences during Q2 2023.

At 67 Richmond Street West and 366 Bay Street, the development projects comprise full modernizations of the properties, including technical systems, interior lighting and elevators, along with enhanced common areas and larger floorplates. The Trust is targeting certain building and project certifications as part of the development projects. A portion of the development costs for these buildings satisfy the terms of the unsecured non-revolving credit facility and term credit facility with the Canada Infrastructure Bank (the “CIB Facility”), which gives the Trust access to an attractive financing program to decarbonize the properties.

During Q1 2023, we settled our zoning by-law appeal with the City of Toronto for our development at 212-220 King Street West in Toronto, Ontario. We are currently working through next steps with our partner. The density approval is for 535,000 square feet of gross floor area, comprising 438,500 square feet of residential area and 96,500 square feet square feet of commercial space including office, retail and hotel, at the Trust’s 50% interest.

As at March 31, 2023, the Trust had approximately $231.3 million of available liquidity(7), comprising $12.4 million of cash, undrawn revolving credit facilities totalling $116.6 million and undrawn amounts on our CIB Facility of $102.2 million which offers low-cost fixed-rate financing for commercial property retrofits to achieve certain energy efficiency savings and greenhouse gas emission reductions. The Trust also had $105 million of unencumbered assets(8) and a level of debt (net total debt-to-net total assets)(9) of 43.0%. On January 30, 2023, the Trust sold 720 Bay Street in Toronto, Ontario for $135 million, the net proceeds of which were used to repay drawings on the $375 million credit facility, reducing leverage from 44.6% as at December 31, 2022 to 43.0% as at March 31, 2023.

During Q1 2023, the Trust drew $2.7 million against the CIB Facility. Since entering into the facility in 2022, we have drawn $10.6 million against that facility. These draws represent 80% of the costs to date for capital retrofits at ten properties in Toronto downtown for projects to reduce the operational carbon emissions in these buildings by an estimated 1,805 tonnes of carbon dioxide, or 52.9%, per year on project completion.

“Dream Office REIT is pleased to deliver its first positive quarter of year-over-year comparative properties NOI growth in Toronto downtown since the pandemic,” said Jay Jiang, Chief Financial Officer of Dream Office REIT. “We are continuing to execute leases at a healthy spread against expiring rents, keeping committed occupancy relatively stable and have already secured leases for over 100% of 2023 lease expiries.”

CAPITAL HIGHLIGHTS


KEY FINANCIAL PERFORMANCE METRICS


As at

(unaudited)


March 31,


December 31,


2023


2022

Financing


Weighted average face rate of interest on debt (period-end)(10)


4.24%


4.42%

Interest coverage ratio (times)(11)


2.3


2.5

Net total debt-to-normalized adjusted EBITDAFV ratio (years)(12)


10.3


10.4

Level of debt (net total debt-to-net total assets)(9)


43.0%


44.6%

Average term to maturity on debt (years)


3.0


3.1

Undrawn credit facilities, available liquidity and unencumbered assets


Undrawn credit facilities (in millions)

$

218.8

$

163.5

Available liquidity (in millions)(7)


231.3


171.6

Unencumbered assets (in millions)(8)


104.8


115.7

Capital (period-end)


Total number of REIT A and LP B units (in millions)(13)


50.3


51.3

Net asset value (“NAV”) per unit(14)

$

31.50

$

31.36

See footnotes at end.

  • NAV per unit(14): As at March 31, 2023, our NAV per unit increased to $31.50 compared to $31.36 at December 31, 2022. The increase in NAV per unit relative to December 31, 2022 is driven by cash flow retention (FFO net of distributions) and the effect of accretive unit repurchases under our normal course issuer bid program, partially offset by fair value losses on investment properties in both regions due to maintenance capital spent but not capitalized. As at March 31, 2023, equity per the condensed consolidated financial statements was $1.5 billion.
  • Investment property disposition: On January 30, 2023, the Trust completed the sale of 720 Bay Street located in Toronto, Ontario for total gross proceeds before adjustments and transaction costs of $135.0 million. Proceeds from the disposition were used to repay drawings on the Trust’s revolving credit facilities.
  • Mortgage extension: On March 13, 2023, the Trust extended the maturity of a $44.3 million mortgage secured by an investment property in downtown Toronto to a new maturity date of May 31, 2025. In connection with the renewal, the Trust entered into a fixed-for-variable swap to fix the interest rate on the mortgage at 5.03%.
  • Demand revolving credit facility: On February 10, 2023, the Trust entered into a $20 million demand revolving credit facility secured by a property in Saskatoon, Saskatchewan. The demand revolving credit facility bears interest at the bankers’ acceptance rate plus 2.00% or at the bank’s prime rate plus 0.50%. The facility is due on demand with no fixed maturity.

CONFERENCE CALL

Dream Office REIT holds semi-annual conference calls following the release of second and fourth quarter results.

OTHER INFORMATION

Information appearing in this press release is a selected summary of results. The consolidated financial statements and Management’s Discussion and Analysis (“MD&A”) of the Trust are available at www.dreamofficereit.ca and on www.sedar.com.

Dream Office REIT is an unincorporated, open-ended real estate investment trust. Dream Office REIT is a premier office landlord in downtown Toronto with over 3.5 million square feet owned and managed. We have carefully curated an investment portfolio of high-quality assets in irreplaceable locations in one of the finest office markets in the world. For more information, please visit our website at www.dreamofficereit.ca.

FOOTNOTES

(1)

Excludes properties held for sale and joint ventures that are equity accounted at the end of each period.

(2)

Excludes properties under development, properties held for sale and joint ventures that are equity accounted at the end of each period.

(3)

Occupancy figures as at March 31, 2022 include sold properties 720 Bay Street in Toronto and Princeton Tower in Saskatoon. Excluding these properties from March 31, 2022 figures, total portfolio in-place occupancy would have been 81.7% and in-place and committed occupancy would have been 85.3%. In Toronto downtown, in-place occupancy would have been 83.5% and in-place and committed occupancy would have been 87.7%.

(4)

FFO is a non-GAAP financial measure. The most directly comparable financial measure to FFO is net income. The tables included in the Appendices section of this press release reconcile FFO for the three months ended March 31, 2023 and March 31, 2022 to net income. For further information on this non-GAAP financial measure please refer to the statements under the heading “Non-GAAP Financial Measures, Ratios and Supplementary Financial Measures” in this press release.

(5)

Comparative properties NOI is a non-GAAP financial measure. The most directly comparable financial measure to comparative properties NOI is net rental income. The tables included in the Appendices section of this press release reconcile comparative properties NOI for the three months ended March 31, 2023 and March 31, 2022 to net rental income. For further information on this non-GAAP financial measure, please refer to the statements under the heading “Non-GAAP Financial Measures, Ratios and Supplementary Financial Measures” in this press release.

(6)

Diluted FFO per unit is a non-GAAP ratio. Diluted FFO per unit is calculated as FFO (a non-GAAP financial measure) divided by diluted weighted average number of units. For further information on this non-GAAP ratio, please refer to the statements under the heading “Non-GAAP Financial Measures, Ratios and Supplementary Financial Measures” in this press release. A description of the determination of the diluted weighted average number of units can be found in the management’s discussion and analysis of the financial condition and results of operations of the Trust for the three months ended March 31, 2023, dated May 4, 2023 (the “MD&A for the first quarter of 2023”) in the section “Supplementary Financial Measures and Other Disclosures” under the heading “Weighted average number of units”.

(7)

Available liquidity is a non-GAAP financial measure. The most directly comparable financial measure to available liquidity is undrawn credit facilities. The tables included in the Appendices section of this press release reconcile available liquidity to undrawn credit facilities as at March 31, 2023 and December 31, 2022. For further information on this non-GAAP financial measure please refer to the statements under the heading “Non-GAAP Financial Measures, Ratios and Supplementary Financial Measures” in this press release.

(8)

Unencumbered assets is a supplementary financial measure. For further information on this supplementary financial measure, please refer to the statements under the heading “Non-GAAP Financial Measures, Ratios and Supplementary Financial Measures” in this press release.

(9)

Level of debt (net total debt-to-net total assets) is a non-GAAP ratio. Net total debt-to-net total assets comprises net total debt (a non-GAAP financial measure) divided by net total assets (a non-GAAP financial measure). The tables in the Appendices section reconcile net total debt and net total assets to total debt and total assets, the most directly comparable financial measures to these non-GAAP financial measures, respectively, as at March 31, 2023 and December 31, 2022. For further information on this non-GAAP ratio and these non-GAAP financial measures, please refer to the statements under the heading “Non-GAAP Financial Measures, Ratios and Supplementary Financial Measures” in this press release.

(10)

Weighted average face rate of interest on debt is calculated as the weighted average face rate of all interest-bearing debt balances excluding debt in joint ventures that are equity accounted.

(11)

Interest coverage ratio (times) is a non-GAAP ratio. Interest coverage ratio comprises trailing 12-month adjusted EBITDAFV divided by trailing 12-month interest expense on debt. Adjusted EBITDAFV, trailing 12-month adjusted EBITDAFV and trailing 12-month interest expense on debt are non-GAAP measures. The tables in the Appendices section reconcile adjusted EBITDAFV to net income for the three months ended March 31, 2023 and March 31, 2022 and for the year ended December 31, 2022 and trailing 12-month adjusted EBITDAFV and trailing 12-month interest expense on debt to adjusted EBITDAFV and interest expense on debt, respectively, for the trailing 12-month period ended March 31, 2023. For further information on this non-GAAP ratio and these non-GAAP financial measures, please refer to the statements under the heading “Non-GAAP Financial Measures and Ratios and Supplementary Financial Measures” in this press release.

(12)

Net total debt-to-normalized adjusted EBITDAFV ratio (years) is a non-GAAP ratio. Net total debt-to-normalized adjusted EBITDAFV comprises net total debt (a non-GAAP financial measure) divided by normalized adjusted EBITDAFV (a non-GAAP financial measure). Normalized adjusted EBITDAFV comprises adjusted EBITDAFV (a non-GAAP financial measure) adjusted for NOI from sold properties in the quarter. For further information on this non-GAAP ratio and these non-GAAP financial measures, please refer to the statements under the heading “Non-GAAP Financial Measures and Ratios and Supplementary Financial Measures” in this press release.

(13)

Total number of REIT A and LP B units includes 5.2 million LP B Units which are classified as a liability under IFRS.

(14)

NAV per unit is a non-GAAP ratio. NAV per unit is calculated as Total equity (including LP B Units) (a non-GAAP financial measure) divided by the total number of REIT A and LP B units outstanding as at the end of the period. Total equity (including LP B Units) is a non-GAAP measure. The most directly comparable financial measure to total equity (including LP B Units) is equity. The tables included in the Appendices section of this press release reconcile total equity (including LP B Units) to equity as at March 31, 2023 and December 31, 2022. For further information on this non-GAAP financial measure please refer to the statements under the heading “Non-GAAP Financial Measures, Ratios and Supplementary Financial Measures” in this press release.

NON-GAAP FINANCIAL MEASURES, RATIOS AND SUPPLEMENTARY FINANCIAL MEASURES

The Trust’s condensed consolidated financial statements are prepared in accordance with International Financial Reporting Standards (“IFRS”). In this press release, as a complement to results provided in accordance with IFRS, the Trust discloses and discusses certain non-GAAP financial measures, including FFO, comparative properties NOI, available liquidity, adjusted EBITDAFV, trailing 12-month adjusted EBITDAFV, trailing 12-month interest expense on debt, net total debt, net total assets, normalized adjusted EBITDAFV – annualized and total equity (including LP B Units or subsidiary redeemable units) and non-GAAP ratios, including diluted FFO per unit, level of debt (net total debt-to-net total assets), interest coverage ratio, net total debt-to-normalized adjusted EBITDAFV and NAV per unit, as well as other measures discussed elsewhere in this release. These non-GAAP financial measures and ratios are not standardized financial measures under IFRS and might not be comparable to similar financial measures disclosed by other issuers. The Trust has presented such non-GAAP financial measures and non-GAAP ratios as Management believes they are relevant measures of the Trust’s underlying operating and financial performance. Certain additional disclosures such as the composition, usefulness and changes, as applicable, of the non-GAAP financial measures and ratios included in this press release are expressly incorporated by reference from the MD&A for the first quarter of 2023 and can be found under the section “Non-GAAP Financial Measures and Ratios” and respective sub-headings labelled “Funds from operations and diluted FFO per unit”, “Comparative properties NOI”, “Level of debt (net total debt-to-net total assets)”, “Net total debt-to-normalized adjusted EBITDAFV ratio (years)”, “Interest coverage ratio (times)”, “Available liquidity”, “Total equity (including LP B Units or subsidiary redeemable units)”, “Adjusted earnings before interest, taxes, depreciation, amortization and fair value adjustments (“adjusted EBITDAFV”)”, “Trailing 12-month Adjusted EBITDAFV and trailing 12-month interest expense on debt”, and “ NAV per Unit”. In this press release, the Trust also discloses and discusses certain supplementary financial measures, including unencumbered assets. The composition of supplementary financial measures included in this press release are expressly incorporated by reference from the MD&A for the first quarter of 2023 and can be found under the section “Supplementary financial measures and ratios and other disclosures”. The MD&A for the first quarter of 2023 is available on SEDAR at www.sedar.com under the Trust’s profile and on the Trust’s website at www.dreamofficereit.ca under the Investors section. Non-GAAP financial measures should not be considered as alternatives to net income, net rental income, cash flows generated from (utilized in) operating activities, cash and cash equivalents, total assets, non-current debt, total equity, or comparable metrics determined in accordance with IFRS as indicators of the Trust’s performance, liquidity, leverage, cash flow, and profitability.

Contacts

For further information:

Michael J. Cooper
Chairman and Chief Executive Officer

(416) 365-5145

mcooper@dream.ca

Jay Jiang
Chief Financial Officer

(416) 365-6638

jjiang@dream.ca

Read full story here

Dream Office REIT Announces $178 Million Bought Deal Secondary Offering of Units of Dream Industrial REIT With Intention to Return Capital to Unitholders

May 5, 2023 By Business Wire

TORONTO–(BUSINESS WIRE)–DREAM OFFICE REAL ESTATE INVESTMENT TRUST (D.UN-TSX) (“Dream Office REIT”, the “Trust” or “we”) today announced it has entered into an agreement to sell, on a bought deal basis, 12,500,000 units of Dream Industrial REIT (DIR.UN-TSX) (the “DIR Units”) at a price of $14.20 per DIR Unit to a syndicate of underwriters led by TD Securities Inc. (the “Underwriters”) for total gross proceeds of approximately $177.5 million (the “Secondary Offering”). Closing of the Secondary Offering is subject to certain customary conditions. The Secondary Offering is expected to close on or about May 16, 2023.

The Trust intends to use the net proceeds from the Secondary Offering, together with cash on hand and drawings under the Trust’s existing credit facility to fund the commencement of a substantial issuer bid (the “SIB Offer”) pursuant to which the Trust will offer to purchase up to 12,500,000 of its outstanding REIT units, Series A (“REIT A Units”) at a purchase price of $15.50 per REIT A Unit in cash (the “Purchase Price”).

Consistent with the Trust’s strategy of maximizing net asset value (“NAV”) per unit for our unitholders, the Trust’s Board of Trustees has authorized the commencement of the SIB Offer as it allows the Trust to monetize a portion of its holdings of 26,039,307 units of Dream Industrial REIT and to offer our unitholders the option to either access liquidity by selling their REIT A Units for cash at a premium to the current trading price of the REIT A Units or potentially increase their ownership in the Trust.

Holders of LP Class B Units, Series 1 of Dream Office LP (“LP B Units”), a subsidiary of the Trust, will be permitted to participate in the SIB Offer by tendering their LP B Units on an as-exchanged basis.

The Purchase Price represents a 23% premium over the closing price of the REIT A Units on the Toronto Stock Exchange on May 4, 2023, the last full trading day prior to this announcement. As at March 31, 2023, the NAV per unit of Dream Office REIT was $31.50 and the NAV per unit of Dream Industrial REIT was $17.03.

Relative to the Trust’s NAV per unit of $31.501 as at March 31, 2023, provided the SIB Offer is successful and fully tendered, the Trust’s pro forma NAV per unit is expected to be approximately $35.85, before transaction costs and fees.

Dream Unlimited Corp. (“Dream”) has advised the Trust that it intends to participate in the SIB Offer, although Dream expects to make a determination of the number of REIT A Units or LP B Units to tender closer to the expiration date of the SIB Offer based on prevailing market conditions and other factors at that time.

“Dream Office has an exceptional portfolio of office properties. The Trust’s ownership in Dream Industrial REIT units represent in excess of 60% of the overall market cap of the Trust. The SIB Offer represents unit repurchases at approximately 51% discount to March 31, 2023 NAV per unit and provides unitholders the ability to maintain the same exposure to the office assets while receiving approximately 31% of the market capitalization of Dream Office. Each unitholder can choose to increase their ownership of Dream Office or more or less maintain their ownership per cent and reduce their capital investment. We will look to opportunistically sell or partner on our existing assets to continually reduce leverage and increase the value of our business,” said Michael Cooper, Chief Executive Officer of Dream Office REIT.

Details of the SIB Offer

Details of the SIB Offer, including instructions for tendering REIT A Units to the SIB Offer and the factors considered by the Board of Trustees in making its decision to approve the SIB Offer, will be included in the formal offer to purchase and issuer bid circular and other related documents (the “Offer Documents”), which are expected to be mailed to unitholders, filed with applicable Canadian Securities Administrators and made available free of charge on or about May 10, 2023 on SEDAR at www.sedar.com and on the Trust’s website at www.dreamofficereit.ca. Unitholders should carefully read the Offer Documents prior to making a decision with respect to the SIB Offer. The SIB Offer will not be conditional on any minimum number of REIT A Units being tendered, but will be subject to various other conditions that are typical for a transaction of this nature.

The SIB Offer will expire at 5:00 p.m. Eastern time on June 19, 2023, unless terminated or extended by the Trust. If more than 12,500,000 REIT A Units are properly tendered to the SIB Offer, the Trust will take-up and pay for the tendered REIT A Units on a pro-rata basis according to the number of REIT A Units tendered, except that “odd lot” tenders (holders beneficially owning fewer than 100 REIT A Units) will not be subject to pro-ration. Assuming that 12,500,000 REIT A Units are purchased pursuant to the SIB Offer, the aggregate purchase price pursuant to the SIB Offer will be $193,750,000. The Trust intends to fund the SIB Offer with a combination of proceeds from the DIR Offering, cash on hand and drawings under the Trust’s existing credit facility.

Our Board of Trustees has obtained an opinion from Cormark Securities Inc. to the effect that, based on and subject to the assumptions and limitations stated in such opinion, there is a liquid market for our REIT A Units as of May 4, 2023 and it is reasonable to conclude that, following the completion of the SIB Offer in accordance with its terms, there will be a market for unitholders who do not tender to the SIB Offer that is not materially less liquid than the market that existed at the time of the making of the SIB Offer. A copy of the opinion of Cormark Securities Inc. will be included in the Issuer Bid Circular.

Our Board of Trustees has authorized the making of the SIB Offer. However, our Board of Trustees is not making any recommendation to any Dream Office REIT unitholder as to whether to tender or refrain from tendering their REIT A Units under the SIB Offer. Unitholders are strongly urged to consult their own financial, tax and legal advisors and to make their own decisions whether to tender or to refrain from tendering their REIT A Units to the SIB Offer and, if so, how many REIT A Units to tender.

Any questions or requests for information may be directed to Computershare Investor Services Inc., as the depositary for the SIB Offer, at 1-800-564-6253 (Toll Free).

About Dream Office REIT

Dream Office REIT is an unincorporated, open-ended real estate investment trust. Dream Office REIT is a premier office landlord in downtown Toronto with over 3.5 million square feet owned and managed. We have carefully curated an investment portfolio of high-quality assets in irreplaceable locations in one of the finest office markets in the world. For more information, please visit our website at www.dreamofficereit.ca.

FOOTNOTE

(1)

NAV per unit is a non-GAAP ratio. NAV per unit is calculated as Total equity (including LP B Units) (a non-GAAP financial measure) divided by the total number of REIT A Units and LP B Units outstanding as at the end of the period. Total equity (including LP B Units) is a non-GAAP measure. The most directly comparable financial measure to total equity (including LP B Units) is equity. For a reconciliation of total equity (including LP B Units) to equity, please see the section “Non-GAAP Financial Measures and Ratios” in the Management’s Discussion & Analysis of Dream Office REIT which section is incorporated by reference herein and as filed under Dream Office REIT’s profile on SEDAR at www.sedar.com. For further information on this non-GAAP financial measure please refer to the statements under the heading “Non-GAAP Financial Measures, Ratios and Supplementary Financial Measures” in this press release.

FORWARD LOOKING INFORMATION

This press release may contain forward-looking information within the meaning of applicable securities legislation, including statements regarding our strategy of maximizing NAV per unit, our ability to opportunistically sell or partner on existing assets, our ability to increase the value of the Trust’s business, the anticipated closing of the DIR Offering; the use of net proceeds from any financings, including the net proceeds from the DIR Offering; our intention to undertake the SIB Offer and the terms thereof, including the aggregate number and purchase price of the REIT A Units we may purchase under the SIB Offer, the expected expiration time of the SIB Offer, the sources and availability of funding for the SIB Offer, the anticipated reduction in the number of outstanding REIT A Units following successful completion of the SIB Offer; and the Trust’s pro forma NAV per unit following the following successful completion of the SIB Offer. Forward-looking information is based on a number of assumptions and is subject to a number of risks and uncertainties, many of which are beyond Dream Office REIT’s control, which could cause actual results to differ materially from those that are disclosed in or implied by such forward-looking information. These risks and uncertainties include, but are not limited to, general and local economic and business conditions, including in respect of real estate; mortgage and interest rates and regulations; inflation; risks related to a potential recession or economic slowdown in certain of the jurisdictions in which we operate and the effect inflation and any such recession or economic slowdown may have on market conditions and lease rates; the uncertainties around the availability, timing and amount of future equity and debt financings; development risks including construction costs, the project timings and the availability of labour; NOI from development properties on completion; the impact of the COVID-19 pandemic on the Trust; the effect of government restrictions on leasing and building traffic; employment levels; the uncertainties around the timing and amount of future financings; leasing risks, including those associated with the ability to lease vacant space; rental rates on future leasing; and interest and currency rate fluctuations. Our objectives and forward-looking statements are based on certain assumptions, which include but are not limited to: that the general economy remains stable; our interest costs will be relatively low and stable; that we will have the ability to refinance our debts as they mature; inflation and interest rates will not materially increase beyond current market expectations; conditions within the real estate market remain consistent; the timing and extent of current and prospective tenants’ return to the office; our future projects and plans will proceed as anticipated; that government restrictions due to COVID-19 on the ability of us and our tenants to operate their businesses at our properties will not be re-imposed in any material respects; competition for acquisitions remains consistent with the current climate; and that the capital markets continue to provide ready access to equity and/or debt to fund our future projects and plans. All forward-looking information in this press release speaks as of the date of this press release. Dream Office REIT does not undertake to update any such forward-looking information whether as a result of new information, future events or otherwise except as required by law. Additional information about these assumptions and risks and uncertainties is contained in Dream Office REIT’s filings with securities regulators, including its latest annual information form and management’s discussion and analysis (“MD&A”). These filings are also available at Dream Office REIT’s website at www.dreamofficereit.ca.

NON-GAAP FINANCIAL MEASURES, RATIOS AND SUPPLEMENTARY FINANCIAL MEASURES

The Trust’s consolidated financial statements are prepared in accordance with International Financial Reporting Standards (“IFRS”). In this press release, as a complement to results provided in accordance with IFRS, the Trust discloses and discusses certain non-GAAP financial measures, including total equity (including LP B Units) and non-GAAP ratios, including NAV per unit, as well as other measures discussed elsewhere in this release. These non-GAAP financial measures and ratios are not standardized financial measures under IFRS and might not be comparable to similar financial measures disclosed by other issuers. The Trust has presented such non-GAAP financial measures and non-GAAP ratios as Management believes they are relevant measures of the Trust’s underlying operating and financial performance. Certain additional disclosures such as the composition, usefulness and changes, as applicable, of the non-GAAP financial measures and ratios included in this press release are expressly incorporated by reference from the MD&A for the first quarter of 2023 and can be found under the section “Non-GAAP Financial Measures and Ratios” and sub-heading labelled “NAV per Unit”. The MD&A for the first quarter of 2023 is available on SEDAR at www.sedar.com under the Trust’s profile and on the Trust’s website at www.dreamofficereit.ca under the Investors section. Non-GAAP financial measures should not be considered as alternatives to net income, net rental income, cash flows generated from (utilized in) operating activities, cash and cash equivalents, total assets, non-current debt, total equity, or comparable metrics determined in accordance with IFRS as indicators of the Trust’s performance, liquidity, leverage, cash flow, and profitability.

Contacts

Michael J. Cooper

Chief Executive Officer

(416) 365-5145

mcooper@dream.ca

Jay Jiang

Chief Financial Officer

(416) 365-6638

jjiang@dream.ca

The Real Brokerage to Launch AI-Powered Digital Personal Concierge to Provide Agents With Immediate Access to Information

May 4, 2023 By Business Wire

Leo bot to draw from Real’s proprietary platform to provide real-time personalized support

TORONTO & NEW YORK–(BUSINESS WIRE)–$REAX #therealbrokerage–The Real Brokerage Inc. (TSX: REAX) (NASDAQ: REAX), the fastest-growing publicly traded real estate brokerage, announced today that it is leveraging GPT to launch Leo, an artificial intelligence-powered assistant that will be integrated with its proprietary transaction management platform, reZEN, to act as a 24/7 concierge to its agents and brokers throughout the U.S. and Canada.

By harnessing the proprietary personal and transaction data that reZEN already maintains about Real agents, Leo will be able to answer individual and specific questions in real time. In addition, it will be programmed to comprehend complex queries, provide accurate responses and learn from each interaction, thereby continually improving its ability to assist agents. Leo also will be customized for each agent, allowing it to understand and cater to their unique needs and working style. This personalized approach ensures that each agent receives the precise support they need, when they need it, making their job easier and more efficient.

“We are excited to see how Leo will enhance the work of our agents,” said Chief Technology Officer Pritesh Damani. “With the power of reZEN’s data and the bot’s advanced capabilities, we are confident that our agents will be better equipped to serve their clients and achieve their goals.”

Designed to act as a personalized digital assistant for Real’s agents, Leo is scheduled to go into beta testing later this quarter. It will be able to answer questions regarding an agent’s professional information, current and past transactions, equity programs, events, revenue share, commissions and finances. Leo will also improve operational efficiencies by minimizing the number of requests submitted to Real’s Customer Support function.

Built from the ground up, The Real Brokerage’s proprietary transaction management platform, reZEN, allows agents to manage an entire real estate transaction from their smartphone, giving them greater control over the transaction experience, including commission payments and advances, form submission and modification, brokerage equity and more. The addition of Leo adds a customized search based on personal transaction and agent-specific data history.

About Real

The Real Brokerage Inc. (TSX: REAX) (NASDAQ: REAX) is revolutionizing the residential real estate industry by pairing best-in-class technology with the trusted guidance of the agent-led experience. Real delivers a cloud-based platform to improve efficiencies and empower agents to provide a seamless end-to-end experience for home buyers and sellers. The company was founded in 2014 and serves 46 states, D.C., and four Canadian provinces with over 10,000 agents. Additional information can be found on its website at www.onereal.com.

Forward-Looking Information

This press release contains forward-looking information within the meaning of applicable Canadian securities laws. Forward-looking information is often, but not always, identified by the use of words such as “seek”, “anticipate”, “believe”, “plan”, “estimate”, “expect”, “likely” and “intend” and statements that an event or result “may”, “will”, “should”, “could” or “might” occur or be achieved and other similar expressions. These statements reflect management’s current beliefs and are based on information currently available to management as of the date hereof. Forward-looking information in this press release includes, without limiting the foregoing, expectations regarding Real’s ability to launch Leo, the timing of Leo’s launch and Leo’s ability to assist agents and improve operational efficiencies.

Forward-looking information is based on assumptions that may prove to be incorrect, including but not limited to Real’s business objectives, expected growth, results of operations, performance, business projects and opportunities and financial results. Real considers these assumptions to be reasonable in the circumstances. However, forward-looking information is subject to known and unknown risks, uncertainties and other factors that could cause actual results, performance or achievements to differ materially from those expressed or implied in the forward-looking information. Important factors that could cause such differences include, but are not limited to, Real’s inability to successfully launch Leo. These factors should be carefully considered and readers should not place undue reliance on the forward-looking statements. Although the forward-looking statements contained in this press release are based upon what management believes to be reasonable assumptions, Real cannot assure readers that actual results will be consistent with these forward-looking statements. These forward-looking statements are made as of the date of this press release, and Real assumes no obligation to update or revise them to reflect new events or circumstances, except as required by law.

Contacts

Investor inquiries:

Jason Lee

Vice President, Capital Markets & Investor Relations

investors@therealbrokerage.com
908.280.2515

For media inquiries, please contact:

Elisabeth Warrick

Director, Communications

elisabeth@therealbrokerage.com
201.564.4221

  • « Previous Page
  • 1
  • …
  • 45
  • 46
  • 47
  • 48
  • 49
  • …
  • 106
  • Next Page »

Sign up for the Daily Digest Email!

Receive the latest news stories from the REIT Report every morning for FREE!

100% Privacy. No SPAM. We promise.

Daily Movers

Ticker News Price Chg Chg%
d.un:ca$14.92.7118.16%
csh.un:ca$9.340.545.78%
ax.un:ca$6.920.223.13%
kmp.un:ca$17.730.623.5%
nwh.un:ca$8.020.222.69%
mrt.un:ca$5.24-0.01-0.19%
grt.un:ca$81.72-0.11-0.13%
hot.un:ca$2.53-0.01-0.39%
fcr.un:ca$15.35-0.05-0.32%
dir.un:ca$14.22-0.41-2.87%
 

Market Snapshot

  • Advertise
  • About
  • Contact
  • Privacy Policy

Copyright © 2025 · REIT REPORT